


Weekly Gold and Silver Technical Analysis Report - 24th June 2007 - Technically Precious with Merv
Commodities / Gold & Silver Jun 24, 2007 - 12:22 PM GMTBy: Merv_Burak

Gold just can't seem to get any steam for a good rally. Weakness seems to be the direction of least resistance.
GOLD : LONG TERM
Still no movement in the long term P&F chart so the last analysis of 25 May 2006 remains valid, i.e. a long term bull with projections to $780 and then to $915. As mentioned at the time, these projections look like pipe dreams but that's what the long term P&F chart is saying. With the present chart I still need a move to $600 before I can invalidate the bull signal and go to a bear.
Since the long term P&F chart is not giving me any further useful information I go to my normal indicators. Here I look at the trend, price momentum, volume action and at times patterns. Long term readers understand that I try to keep it simple and not muddy up the waters with sophisticated analysis. Over many years of doing this stuff I have not found going sophisticated to have any great advantage over just keeping things simple. Besides, simple takes less work and for a lazy individual that's important.
Gold dropped below its long term moving average line (I use a 200 day or 40 week weighted moving average) and ended the week just below the line. More importantly, the moving average line is still pointing slight upwards for a still positive reading. As for price momentum, or strength, I use the 150 day or 30 week RSI. The daily version I find better but either is okay. Momentum is still slightly in the positive zone but only slightly so and getting weaker. It is very close to the lowest momentum reading since after the top in May of 2006. Of concern is the fact that the indicator is still below its negatively sloping trigger line so that there is no hint yet of a potential strengthening in the momentum action. As for the volume action, the indicator (On-Balance Volume) continues to move lower, below its negatively sloping long term trigger line.
There are some analysts that see a double top in the gold activity. I don't think so. I would be very cautious about considering the gold action alone as representing a double top. HOWEVER, my Composite Index of Precious Metals Indices which includes some 20 different Indices plus gold, silver and the US $ HAS shown a potential long term double top. See analysis and chart later in this commentary.
For now I must remain BULLISH on the long term but do understand that things are weakening and this may not yet be the time to be risking additional capital in any long term investments. This is still, in my view, a gambler's market.
INTERMEDIATE TERM
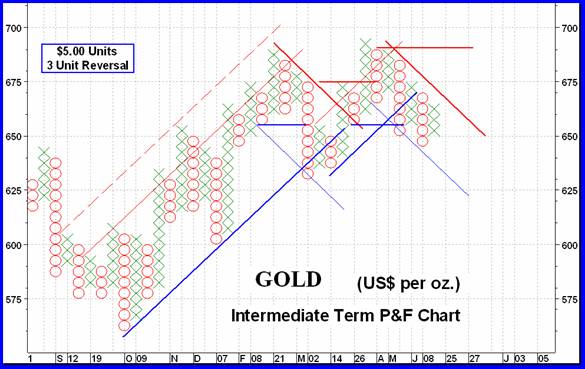
Since early this year the intermediate term P&F chart had undergone a few reversals (see chart on next page). Per my criteria the chart must cross the down trend line and move above two previous X s for a bull reversal. The reverse is true (up trend line and two O s) for a bear reversal. On the chart the red are resistance lines while the blue are support lines. This year we have had three reversals, two to the bear and one to the bull. This is not the sign of a stable market. It is more a sign of a market that can't make up its mind which way to go, and that implies weakness.
The latest signal was a bear signal with a projection down to the $605 level, just short of a long term reversal price. We do have an intermediate term potential double top but as I mentioned in earlier commentaries, the double top is a “potential” until it is confirmed by a drop below the lowest price in between tops. That would be the $635 low. Should that happen, and it still is some distance to go, the double top projection would then take us to $565, which is in the previous October 2006 low area. For now these are all just interesting numbers we technicians like to play with. If none come true then we go on with what's next. If some do come true then we have no problem telling the world how right we were. The more numbers the more probability of one being right.
Going to my normal indicators, gold is still below my intermediate term negatively sloping moving average line (I use a 65 day or 13 week weighted moving average). Price momentum (a 50 day RSI) is still in its negative zone below its trigger line. The trigger line is almost horizontal and may be on the verge of turning up should we have another day or two of positive gold action. As for the volume indicator, it is below its negatively sloping trigger line for a negative reading.
All in all, there is no reason to change my BEARISH position from last week.
SHORT TERM
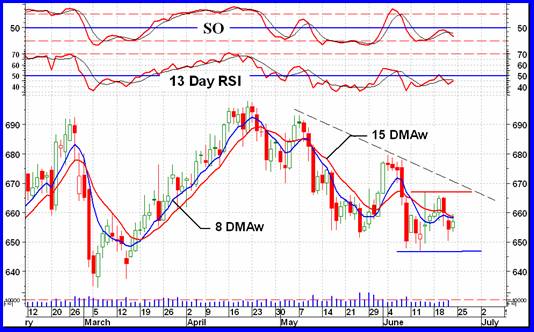
Last week I remained bearish on the short term, going with the existing trend until a reversal was confirmed. That reversal was stated as a close at or above $667. Well, that never materialized and we are still in a short term bear although the chart indicates more of a lateral trend in progress. With the short term momentum (13 day RSI) still in the negative zone and gold below its short term moving average line (15 day weighted moving average) we are still in a short term bear. However, we need a close below $647 to reconfirm the trend as the lateral trend is becoming more pronounced.
IMMEDIATE TERM
Here we go with the flip of the coin. It came up tails so we continue to expect more down side action in the next day or two. Gold is below its very short term moving average line and the Stochastic Oscillator continues in its negative zone and is once more below its trigger line. Other than expecting more down side, a close above $660 might get us back into an immediate term bullish move, for a few days.
NORTH AMERICAN GOLD INDICES
We're back to the PHLX Gold & Silver Sector Index ( XAU ) in my rotating look at the major Indices.
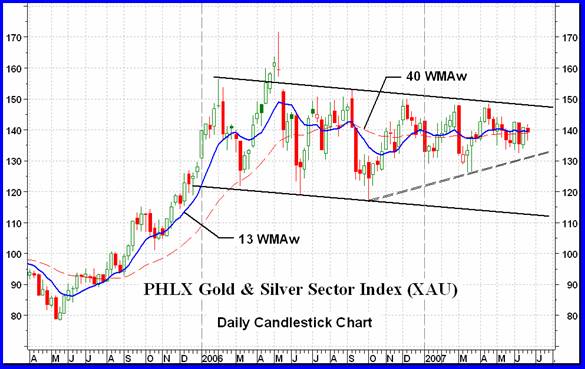
What we see here in the year long gently downward sloping channel is what is referred to as a “flag” pattern. It is often a continuation pattern if formed after a long sharp move in price. This flag we have here is huge, like when people try to show off that they have the biggest flag in town. It's interesting to note that although we have a bullish flag pattern in the XAU we have a bearish double top pattern for the overall gold market. Which one will prove to be right? For now I think I would go with the double top, this flag just looks too big to be true.
In addition to the flag, over the past several months we have a triangular pattern forming. Now some books are bullish on this pattern but I would wait and see which way it breaks before placing any money on it.
Apart from the two patterns we are in a major lateral move which has to break one way or the other before we have a good idea as to the next market direction.
MERV'S PRECIOUS METALS INDICES
At the beginning of this commentary I made reference to the Composite Index of Precious Metals Indices. First shown here on 20 April 2007 just as it made its second top this Index is a composite of some 20 different precious metals Indices as well as gold, silver and the US$. The real importance of this Index is still unknown but it is probably the only precious metals Index giving such a clear long term potential double top picture. Since April its direction has been basically towards lower levels.
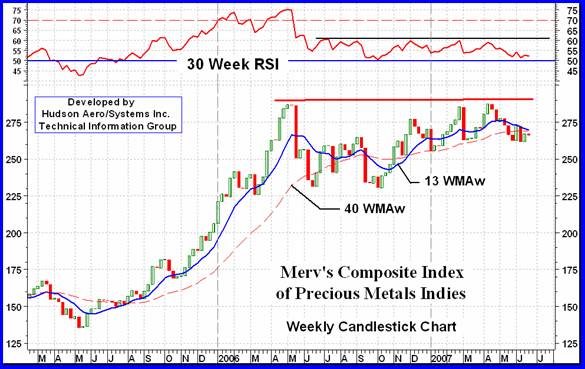
Another interesting feature of this chart is the momentum indicator. Although the Index is near its upper end of a year long trading range the indicator is at almost its lower end. The weakening in momentum is normal during a long lateral trading period but also could indicate something more serious, a serious deterioration in the price strength which could culminate into a reversal of trend. These are just some things to consider and watch to see what happens next.
MERV'S GOLD & SILVER 160 INDEX
SO, what's REALLY happening in the precious metals universe? Although all the major North American Gold Indices lost ground during the week, if only a little, the universe of 160 precious metal stocks gained ground, if only just a little. The 160 Index closed the week ahead by 0.3%. On the other hand there were more losers than gainers on the week with 69 stocks (43%) closing higher and 85 stocks (53%) closing lower. The easy answer for this difference is that the upside stocks had better plus performances than the down side stocks minus performances. Most of the plus stocks were in the more speculative category as seen by the better performance of the speculative Indices versus the quality Indices.
With the small weekly movement in the Index there was little change in the ratings so I'll save time and just summarize the ratings for this week. Still BEARISH on the intermediate term and BULLISH on the long term.
MERV'S QUAL-GOLD INDEX : MERV'S SPEC-GOLD INDEX : MERV'S GAMB-GOLD INDEX
Here we see why the majors were down on the week while the universe was up. The Qual-Gold Index, the sector most like the majors, was down on the week by 0.5%. The Spec-Gold Index, just behind the Qual-Gold in “quality”, gained 0.1% on the week. The gambling stocks, represented by the Gamb-Gold Index, were ahead by 1.7%. It looks like speculators had come nibbling at some of what looked like bargains in the speculative or gambling stocks. It remains to be seen if they were bargains or not.
With very little movement during the week I'll just summarize the ratings as the charts show.
Qual-Gold: intermediate term BEARISH, long term NEUTRAL
Spec-Gold: intermediate term BEARISH, long term BULLISH
Gamb-Gold: intermediate term NEUTRAL, long term BULLISH.
SILVER
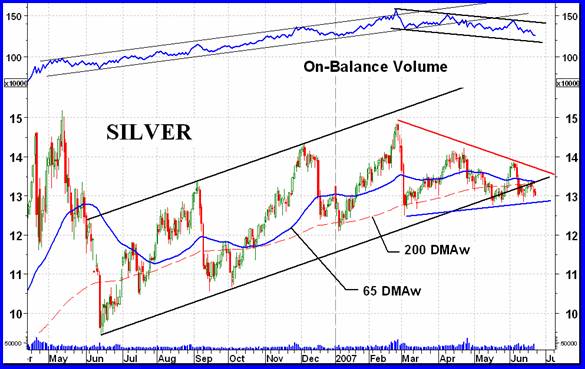
Silver is still hanging in there and hasn't made up its mind which way it wants to go. However, trapped in that triangle pattern it has to break out one way or the other soon. The path of least resistance seems to be towards the down side. This is what the volume indicator is telling us. The recent volume action has been mostly on the down side with the indicator now at a level it last was at several months ago. It is well ahead of the price on the down side. Price should be following the volume action shortly. Stay tuned.
MERV'S QUAL-SILVER INDEX : MERV'S SPEC-SILVER INDEX
As with the gold Indices, here too we see the action has been towards the more speculative stocks and away from the quality. The Qual-Silver Index closed the week 0.9% lower while the Spec-Silver Index closed the week 2.6% higher. With silver itself lower on the week speculators seemed to have turned towards the more speculative stocks for “bargains”. Bargain hunting is very risky and not for the armatures.
With very little movement during the week I will just summarize the ratings and not go into details this week.
Qual-Silver: intermediate term BEARISH, long term BULLISH
Spec-Silver: intermediate term BEARISH, long term BULLISH
Note that the Spec-Silver is the one Index where I had changed the rating from last week. Last week it was neutral.
MERV'S PRECIOUS METAL INDICES TABLE
That's it for this week.
By Merv Burak, CMT
Hudson Aero/Systems Inc.
Technical Information Group
for Merv's Precious Metals Central
Web: www.themarkettraders.com
e-mail: merv@themarkettraders.com
During the day Merv practices his engineering profession as a Consulting Aerospace Engineer. Once the sun goes down and night descends upon the earth Merv dons his other hat as a Chartered Market Technician ( CMT ) and tries to decipher what's going on in the securities markets. As an underground surveyor in the gold mines of Canada 's Northwest Territories in his youth, Merv has a soft spot for the gold industry and has developed several Gold Indices reflecting different aspects of the industry. As a basically lazy individual Merv's driving focus is to KEEP IT SIMPLE .
To find out more about Merv's various Gold Indices and component stocks, please visit www.themarkettraders.com and click on Merv's Precious Metals Central . There you will find samples of the Indices and their component stocks plus other publications of interest to gold investors. While at the themarkettraders.com web site please take the time to check out the Energy Central site and the various Merv's Energy Tables for the most comprehensive survey of energy stocks on the internet. Before you invest, Always check your market timing with a Qualified Professional Market Technician
Merv Burak Archive |
© 2005-2022 http://www.MarketOracle.co.uk - The Market Oracle is a FREE Daily Financial Markets Analysis & Forecasting online publication.