


Stock Market, A Peter Pan Market
Stock-Markets / Stocks Bear Market Sep 24, 2009 - 03:27 AM GMTBy: Brian_Bloom

 Only in Never Never Land can age and gravity be defied. In the real world such ideas may be described as “escapist fantasies”.
There has been much debate in recent weeks regarding whether US Equities have entered a new Primary Bull Trend or whether we have been witnessing a bounce in a Primary Bear Trend.
Let us not mince words. In the view of this analyst we have been witnessing a bounce.
Clearly, anything that one reads in the media may be regarded as history. In this case, however, it is arguable that the media stories are so bleak because the economic outlook is in fact bleak. Arguably, the typical investor is rationalizing that things cannot get worse and that, therefore, now is buying time.
Again, not to mince words: In this analyst’s view those who are arguing that the markets have bottomed are guilty of selective perception. They are ignoring some very important facts.
Below is factual evidence that the world economy is very likely still contracting and that, in the USA in particular, further economic contraction may be expected and, finally, that the US Equity Market is an accident waiting to happen..
Definition: “The Baltic Dry Index (BDI) is a number issued daily by the London-based Baltic Exchange. Not restricted to Baltic Sea countries, the Index tracks worldwide international shipping prices of various dry bulk cargoes.
The index provides "an assessment of the price of moving the major raw materials by sea. Taking in 26 shipping routes measured on a time charter and voyage basis, the index covers Handymax, Panamax, and Capesize dry bulk carriers carrying a range of commodities including coal, iron ore and grain."[1] Source: http://en.wikipedia.org/wiki/Baltic_Dry_Index
In simple English, the interplay of forces of demand for and supply of freight shipping services eventually manifest as a price of freight shipping. In turn, various prices from various regions are incorporated into the Baltic Dry Index to give a global overview.
It can be seen from the chart below that the Baltic Dry Index has been falling even as the price of oil (which is the primary fuel for shipping) has been rising. In short, demand has been so weak that shipping companies have been unable to pass on rising costs.
Source: http://investmenttools.com/futures/bdi_baltic_dry_index.htm#bdi_log
Baltic Exchange Dry Index (BDI) & Crude Oil (red)
The chart below shows that the $SPX – like the price of oil – has been rising, notwithstanding the weak demand for shipping.
Baltic Exchange Dry Index (BDI) & SP500 (green)
Now, as prudent people, we need to determine whether the low level of the BDI reflects a bottom or whether there may be further downside potential.
As a starting point, let’s look at a quote from the Supply Management Institute’s latest report on September 1st 2009: Source: http://www.ism.ws/ISMReport/content.cfm?ItemNumber=19642 (Note: PMI = Production Manager’s Index.)
“Global PMI Rose Above 50.0 for First Time since May 2008
The rebound of the global manufacturing sector continued to gain traction in August. At 53.1, up from 50.0 in July, the JPMorgan Global Manufacturing PMI posted it highest reading for twenty-six months and rose above the neutral 50.0 mark for the first time since May 2008.
Production increased for the third month running in August and at the fastest pace for forty months. The expansion was broad-based by nation, with gains especially marked in the US (growth at a near four-year high), Japan (three-and-a-half year high), and emerging Asian economies. The rate of expansion in China hit a 22-month peak, but in India eased to the weakest in the current period of recovery.”
So, if the PMI has bottomed and is heading back up again, then we should expect demand for freight shipping to be rising. But demand for freight shipping has demonstrably not been rising. Hmmm?
This begs the question: What is driving the (supposedly) rising PMI? Put another way: Who is buying what the manufacturers are selling?
Bearing in mind that manufacturing in the USA no longer drives the US economy, we should be looking for an increase in non manufacturing activity in the US which might be “driving” a rising level of consumer optimism in the USA which, in turn, would be leading to more orders being placed out of the USA for manufactured goods.
Unfortunately for the US, in terms of the August data for the non manufacturing sector in the USA, it would appear that it has not been buoyant business conditions in the USA that has been driving the Global PMI. As can be seen from the quote below, even though the non manufacturing business activity index has risen above 50%, the New Orders Index is still below 50% and the Employment Index is well below 50%. Numbers below 50% indicate that the relevant sectors are still shrinking which, in turn, implies that unemployment within the US could still rise further.
Quote: “The report was issued today [September 1st 2009] by Anthony Nieves, C.P.M., CFPM, chair of the Institute for Supply Management™ Non-Manufacturing Business Survey Committee; and senior vice president — supply management for Hilton Hotels Corporation. "The NMI (Non-Manufacturing Index) registered 48.4 percent in August, 2 percentage points higher than the 46.4 percent registered in July, indicating contraction in the non-manufacturing sector for the 11th consecutive month but at a slower rate. The Non-Manufacturing Business Activity Index increased 5.2 percentage points to 51.3 percent. This is the first time this index has reflected growth since September 2008. The New Orders Index increased 1.8 percentage points to 49.9 percent, and the Employment Index increased 2 percentage points to 43.5 percent. The Prices Index increased 21.8 percentage points to 63.1 percent in August, indicating a substantial increase in prices paid from July. According to the NMI, six non-manufacturing industries reported growth in August. Respondents' comments are mixed about business conditions and the overall economy; however, there is an increase in comments indicating that there are signs of improvement going forward." (Source: http://www.ism.ws/ISMReport/NonMfgROB.cfm?navItemNumber=12943 )
The reader should not lose sight of the “cash for clunkers” program in the USA and/or of other freebies that the US (and other) governments have been offering as part of various stimulus packages. In essence, it is arguable that the US Government (and other governments) have been buying economic growth by throwing “gift” money at consumers, much of which has been diverted to non USA based manufacturers. For example, it is this analyst’s understanding that a primary manufacturing beneficiary of the cash for clunkers program was Japan.
The following is quote from an article published on August 18th 2009:
“Toyota has inched ahead in terms of which automaker is benefiting most from the Cash for Clunkers program. With 358,851 deals submitted to the government through the Car Allowance Rebate System at a value of $1.5 billion, Toyota has the largest share of cars purchased, at 18.9%. GM is in second place with 17.6% of all sales, followed by Ford (15.4%), Honda (12.9%) and Chrysler (9.1%).” Source: http://blogs.cars.com/kickingtires/2009/08/toyota-pulls-ahead-in-cash-for-clunkers-sales.html
Toyota and Honda in combination accounted for 31.8% of the cash for clunkers market whereas the three USA manufacturers in combination accounted for 39.1%. Arguably, this would go some way towards explaining the quote above that: “The expansion was broad-based by nation, with gains especially marked in the US (growth at a near four-year high), Japan (three-and-a-half year high),….”
Now let us turn our attention to the unemployment numbers in the USA and we should bear in mind that the US consumer has historically accounted for up to 70% of the US GDP:
The following is a quote from the August Economic News Release of the US Department of Labor:
“Nonfarm payroll employment continued to decline in August (-216,000),
and the unemployment rate rose to 9.7 percent, the U.S. Bureau of Labor
Statistics reported today. Although job losses continued in many of the
major industry sectors in August, the declines have moderated in recent
months.” (Source: http://www.bls.gov/news.release/empsit.nr0.htm )
Some might argue that this analyst is being a wet blanket by focusing on the fact that unemployment statistics in the US exclude those unemployed people who are no longer looking for work; and also excludes those who are working part time but would prefer to work full time. From the same report:
“About 2.3 million persons were marginally attached to the labor force
in August, reflecting an increase of 630,000 from a year earlier. (The
data are not seasonally adjusted.) These individuals were not in the
labor force, wanted and were available for work, and had looked for a
job sometime in the prior 12 months. They were not counted as unemployed
because they had not searched for work in the 4 weeks preceding the sur-
vey.”
Now we need to turn our attention to the forecast Trailing Twelve Months, GAAP adjusted profits as reported by Standard and Poor. (source: DecisionPoint.com)
Trailing Twelve Month GAAP adjusted earnings and P/E ratios
|
|
Est |
Est |
Est |
Est |
|
2009 Q1 |
2009 Q2 |
2009 Q3 |
2009 Q4 |
2010 Q1 |
TMT P/E Ratio (GAAP) |
154.6 |
141.3 |
139.4 |
27 |
24.3 |
TMT Earnings (GAAP |
$6.86 |
$7.51 |
$7.61 |
$39.35 |
$43.58 |
As of September 23rd 2009, the P/E ratio of the $SPX was 154.6X. This flowed from the fact that underlying earnings adjusted for GAAP were around $6.86.
The P/E ratio is being forecast to fall to 24.3X (still an historically seriously overvalued number) assuming that the forecast 2010 Q1 Twelve Month Trailing Earnings number actually materializes.
Arguably, many people are focusing on the “reasonableness” of this forecast in context of the fact that “one time” losses will have been absorbed and corporations will be able to get on with the job of generating “normal” earnings.
In this analyst’s experience, numbers speak louder than words. Below is a hypothetical model of an imaginary corporation’s profit numbers assuming a Gross Profit Percentage of 50%, fixed costs of 30% of the starting revenue number, variable costs of 10%; and assuming that the revenue line shrinks by 7.5% because of the increased unemployment levels in the country.
Notional Example of Business Profit Model Before and After Revenue Reduction
Assuming no “paring” of fixed expenses, a 7.5% reduction in revenue leads to a 30% reduction in Net Profit Before Tax. Of course, there will undoubtedly be some paring of expenses in the form of lower wage costs, but other expenses such as rentals will remain constant or may even rise. The in-principle point of the argument being put forward by this analyst is that the $43.58 number above is probably both optimistic and unachievable given the downward pressures on the revenue line flowing from high (and still rising) unemployment; and given the fact that consumer spending accounts for such a high proportion of US GDP.
Of course, one needs to acknowledge the argument of the Bulls that the $2 trillion incremental borrowing by the US Federal Government – aided and abetted by the actions of US Federal Reserve which is steadfastly refusing to divulge what the $2 trillion has been spent on notwithstanding having been ordered to do so by the courts – is “likely” to be inflationary. Whilst this analyst will certainly acknowledge the argument, the facts do not support the conclusion that the argument is true.
In context of the chart below, we do not need to know the answer to the question of “what did you spend it on?” to know that Mr. Bernanke’s high profile statement that “the recession is over” was a Peter Pan type statement
The chart below – of the Velocity of Money – (source: http://research.stlouisfed.org/publications/mt/page12.pdf ) shows that velocity of M2 has decreased from around 1.75X in early 2008 to around 1.5X as at September 11th 2009; and that velocity of money is still declining.
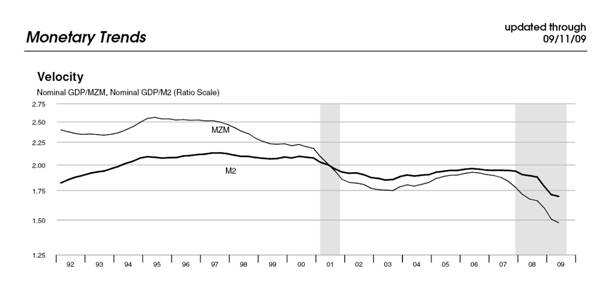
Let’s look at the M2 level in January 2008 and in August 2009:
M2 X Velocity of M2 = “rough” approximation of GDP
Conclusion
Qualitative arguments to the contrary, the back-of-the-envelope numbers indicate that price inflation will not be sufficient to overcome the falling velocity of money and, therefore, even nominal GDP is unlikely to grow. It follows that the forecast Twelve Month Trailing earnings (GAAP adjusted by Standard and Poor) will unlikely show any growth on the year immediately preceding the financial meltdown. The forecast P/E ratio of 24.3X is therefore “wildly optimistic” in terms of historical benchmarks, given that high P/E ratios typically anticipate strong growth. The facts show that whilst the world economy may or may not bounce from its current low levels, even if it does bounce, the forecast earnings of $43.58 seems highly unlikely.
When investors finally come to understand that it is only in Peter Pan’s Never Never Land that age and gravity can be defied, there will likely be a downward adjustment of P/E ratios to at least historically “normal” levels of 15X and perhaps as low as 10X.
In terms of the chart below, courtesy DecisionPoint.com, the most likely outcome is a fall in the S&P to around the 500 – 600 level – which is the 77 year trend line.
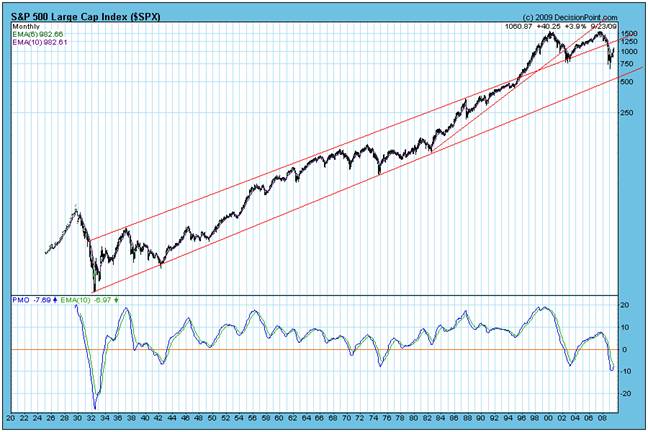
The timing of this cannot be precisely pinpointed because it depends on how long it will take for investors to come to understand that the “green shoots” argument has been nothing other than politically inspired gobbledegook. It is not “earnings” that we have to worry about so much as Price/Earnings ratios. It needs to be remembered that, at a Price/Earnings ratio of 24.3X, it will take 24.3 years to recover one’s investment. And this assumes that the profitability of the underlying company remains constant at levels which seem outrageously optimistic in the first place.
Overall Conclusion
The upward movement in the US equity markets which commenced in March 2009 has been a bounce within a Primary Bear Market. In this analyst’s view there will be no new Primary Bull market.
Author’s Comment
Why is this author so “confident” he is right when there are so many people – arguably more qualified and more knowledgeable than he – who are arguing for a re-emergence of the Primary Bull Trend? Well, there are two possibilities:
- I am not correct. That is, of course, always a possibility which should not be discounted
- Unlike the Central and Commercial bankers of this world, I understand in my bones that “wealth” does not come out of a printing press.
Those who are arguing for investing in equities on the basis that we are heading for inflation are not only ignoring the decreasing velocity of money. They are also ignoring the fact that there is no shortage of supply of anything except, possibly, energy. They are also ignoring the fact that wages lag inflation and that ordinary people are forced to cut back when prices rise because they can’t afford to pay the higher prices. They are also ignoring the massive overhang of consumer debt which, in particular, is rendering the asset side of the balance sheets of the commercial banks highly suspect. In context of the large number of domestic mortgages in the USA which have a balance owing that is greater than the value of the underlying real estate security, the US banking industry is surviving on silver tongue bullshit artistry – not to put too fine a point on it.
The core issue, as I have outlined in some detail in my factional novel, Beyond Neanderthal, is that the primary “driver” of the world economy – Oil – is no longer able to drive the world economy. We absolutely have to find a “baseline” alternative to oil; and solar power and wind simply will not cut it.
The politicians (and the physicists) will argue that, therefore, we will have no choice but to embrace nuclear fission. Well, that may be and I am currently researching a second factional novel which will look at all aspects of nuclear power – including the politically oriented aspects.
In the meantime, Beyond Neanderthal puts forward the possibility of a couple of alternatives which mainstream scientists will reject out of hand because they appear to fly in the face of well understood scientific principles. My counter-argument is this: The various “laws” of physics do not have to be broken for an apparently impossible new idea to be possible. There may be some aspect of the laws of physics in respect of which we have yet to gain a full understanding – for example, the concept of Zero Point energy is not fully understood. Therefore, we should keep an open mind and not dogmatically argue theory when it may be pragmatically possible to test the claims of the inventors of the new technologies coming down the turnpike.
I ask the reader to keep an open mind. Please buy a copy of Beyond Neanderthal – either via Amazon or via the website link below. Please read it with an open mind and ask yourself: “What if there is something to the claims of these so-called crackpot inventors? Shouldn’t we at least investigate them before we reject these claims?”
Brian Bloom
Beyond Neanderthal is a novel with a light hearted and entertaining fictional storyline; and with carefully researched, fact based themes. In Chapter 1 (written over a year ago) the current financial turmoil is anticipated. The rest of the 430 page novel focuses on the probable causes of this turmoil and what we might do to dig ourselves out of the quagmire we now find ourselves in. The core issue is “energy”, and the story leads the reader step-by-step on one possible path which might point a way forward. Gold plays a pivotal role in our future – not as a currency, but as a commodity with unique physical characteristics that can be harnessed to humanity's benefit. Until the current market collapse, there would have been many who questioned the validity of the arguments in Beyond Neanderthal. Now the evidence is too stark to ignore. This is a book that needs to be read by large numbers of people to make a difference. It can be ordered over the internet via www.beyondneanderthal.com
Copyright © 2009 Brian Bloom - All Rights Reserved
Disclaimer: The above is a matter of opinion provided for general information purposes only and is not intended as investment advice. Information and analysis above are derived from sources and utilising methods believed to be reliable, but we cannot accept responsibility for any losses you may incur as a result of this analysis. Individuals should consult with their personal financial advisors.
Brian Bloom Archive |
© 2005-2022 http://www.MarketOracle.co.uk - The Market Oracle is a FREE Daily Financial Markets Analysis & Forecasting online publication.