Stock Market Rally Running Out of Time
Stock-Markets / Articles Sep 25, 2009 - 10:52 AM GMT We are running out of time. Time is more important than price. When a cycle top or bottom is due the Stock Market will turn regardless if price targets have been reached.
Now we are approaching the top of a crest to be expected to unfold around mid to end of September 2009. I have a bias for September 28/29th as at that point gravity is at the lowest point in the year and Mercury turns direct. This is why the stock market has been ascending so long, but I guess the influence of gravity could become less and less as we approach September 28th.
How does that work? When gravity is low, there is less pressure on the earth and on the minds of us all, so we feel less depressed and more optimistic, so we take more risks on the stock market.
Gravity is at the highest point around February and March of each year as well. If you get the message, you will see that gravity around that time causes the stock market to reach often their lowest point in the year. Hence, the gravity, due to the Sun, Moon pulling at us, causes a natural seasonality. This causes natural cycles to occur that are very powerful. This even has effects on nature around us.
At September 29th, 2009 Mercury, now in retrograde mode (as if moving away from earth). goes direct again(moving towards earth).
Mercury effects commerce and the communications, negotiations around it thus preventing clear messages coming through to investors; hence more fluctuations on the stock market as we perceive to receive mixed messages. During a retrograde mode the stock markets fluctuates more often, and going direct again the stock markets usually changes direction as well. Within a span of 8 days there is a great probability of a greater cycle crest to unfold, for which we have been waiting for.
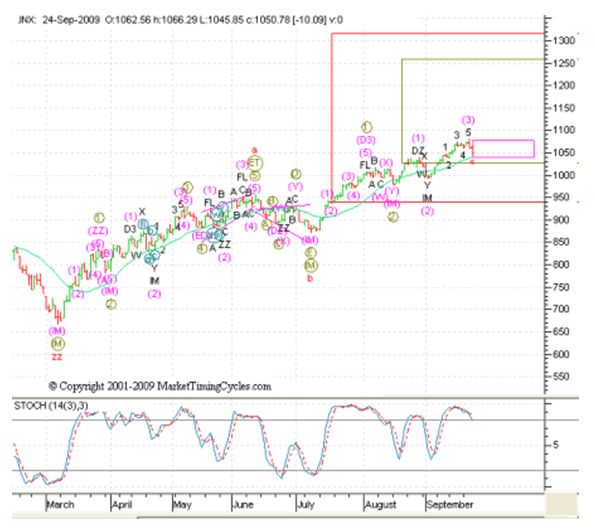
So, this all means we are close to the top of the Elliott wave C of 4 of some degree. The top could already have been set in, but there are still scenario’s to consider a last wave could be possible to finish of the corrective pattern or counter trend.
The counter trend usually unfolds in a simple zigzag and abc format. See below (still) preferred scenario.

Reviewing this scenario it seems that this scenario in time does not really fit the price and time targets to be expected end of September. We need far more time to unfold wave C of 4 in this scenario.
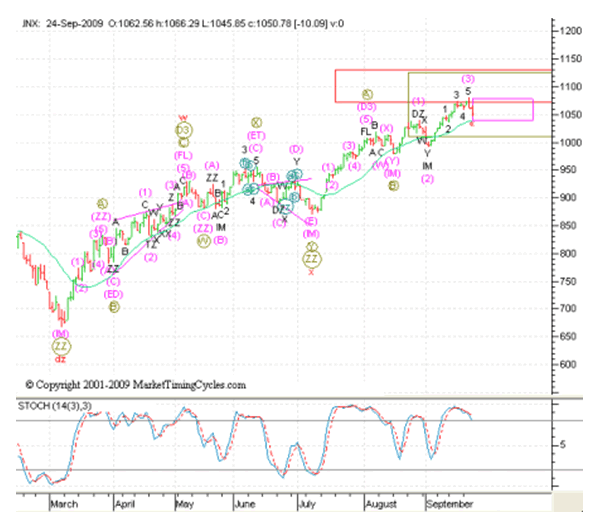
There is however an alternative scenario to consider: a double zigzag. This better fits with the observation that the market is struggling.
Resistance from the larger trend is preventing to form a clear impulsive wave. Hence more corrective sub waves are formed. Look at the alternative scenario below.

This alternative scenario, seriously should be taken into consideration. The pattern still could unfold in a 5 wave completing wave C of Y and completing the double zigzag at the expected time target.
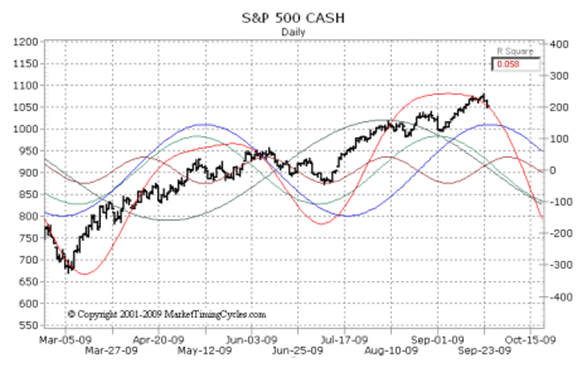
From a cycle point of view, we are approaching the crest of some dominant cycles. Have a look at below analysis on the dominant medium term cycles.

The composite trend (shown in red), composed out of 4 dominant medium term cycles, is already turning suggesting the top has been set in.
However this was also the case in May/June this year, while the stock market kept on going ascending before turning down and form a sideways pattern staring in May.
If you review the current mode the cycles are in, one of the cycles could still cause the stock market to form a last wave. This could be a higher high, but due to the other cycles it also could cause the stock market to form a double top at the recent high or just below it.
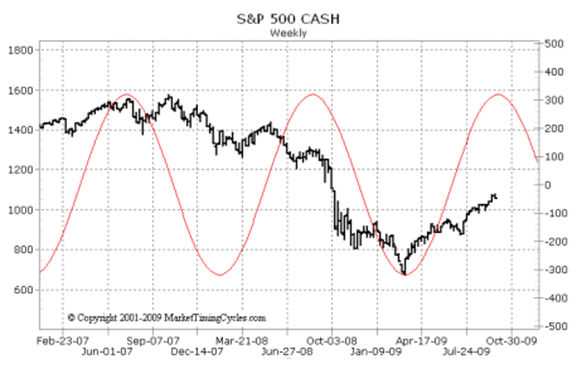
The longer term dominant cycle is still due at the end of September +- 1 trading week. There is a high probability this cycle will start a new cycle wave downwards any time from now. This cycle forms a Fibonacci relationship of 144 days between highs and lows in the market after which the market turns. It is usually spot on within 1 week. The Bartels test shows a very significant correlation of this cycle to repeat in the future. (I will post more on this during the weekend). Have a look at below analysis.

This dominant cycle tells me, we are right in the middle of the time span this cycle could turn direction. If our analysis is right we are clearly running out of time towards ds the time target of September 28th/29th 2009 +- 1 trading week.
Combining the Elliott wave scenario’s with the cycle scenario’s mentioned in this article there is a high probability the market will turn anytime from now, if not already done. There is no guarantee, as anomalies can happen the Stock market distorting the cycles for some time.
Don’t jump after it, if the market already turned, it usually will bounce back first on a second wave, before really turning south. You do not want to be caught in that retracement. Take care!
We will be posting more stock market analysis for our selective group of subscribers through our postings on markettimingcycles.com. If you want to be kept up-to-date on our cycle research and stock market commentaries please subscribe to our newsletter below now.
Join a group of select individuals and subscribe to our newsletter here and we will put you on our mailing-list. We respect your privacy. We don’t sell, rent or share your name or email address.
© 2001-2009 MarketTimingCycles.com. www.markettimingcycles.wordpress.com
This article is not part of a paid subscription service. It is a free service and is aimed to educate and demonstrate the successful application of cycle analysis. At no time will specific security recommendations or advice be given. Whilst the information herein is expressed in good faith, it is not guaranteed. A trading system that never makes mistakes does not exist. Error and uncertainty are part of any effort to assess future probabilities. Trade at your own risk. Read our full disclaimer.
© 2005-2022 http://www.MarketOracle.co.uk - The Market Oracle is a FREE Daily Financial Markets Analysis & Forecasting online publication.


