What If This Stocks Bear Market Is Not Over?
Stock-Markets / Stocks Bear Market Oct 12, 2009 - 01:43 PM GMTBy: Charles_Maley
 Once again it seems like the gurus have a general consensus that the March lows are the final lows for this bear market. Since I am not in the prediction business, I will not say, but I will pose a question. What if they are wrong? It’s not like they haven’t been in the past. If they are wrong how bad could it get?
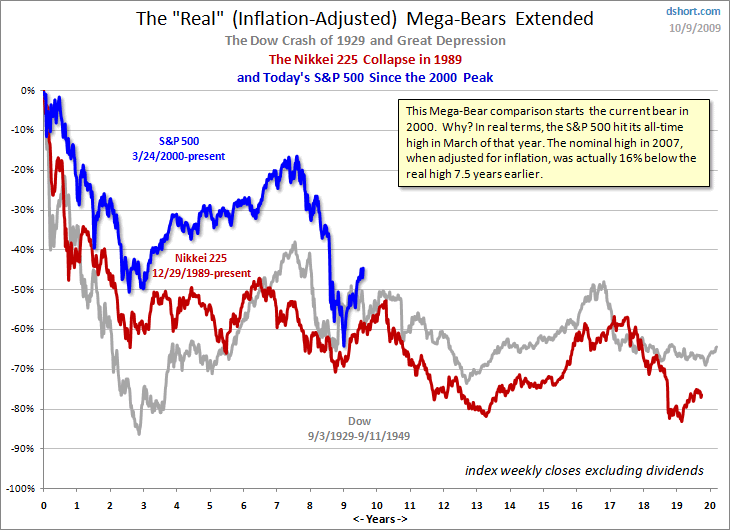
I really don’t know, but I do try to look at different scenarios as to keep the surprises down. One such scenario would be to compare it to a few other “mega bear” markets. The first chart, (compliments of dshort.com) includes an inflation adjusted chart, assuming an S&P 2000 peak. It is a disturbing picture of the impact of inflation on long-term market prices. It also reminds us how long these major bear markets can last, if in fact we are in one now.

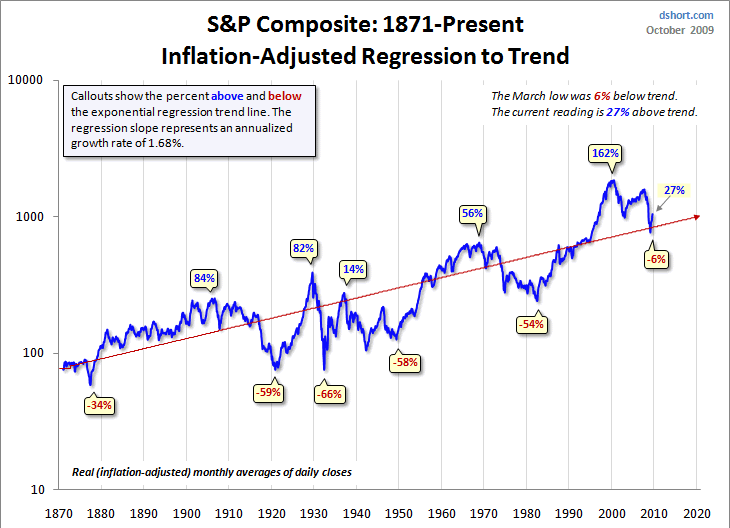
The second chart shows The Standard and Poor’s secular trends, with respect to a regression growth rate line. Notice how previous bear market lows were quite a bit below the regression line, ranging from 34% to 66%. The recent bear market lows were only 6% below, suggesting that this could have been just a regression to the mean, or a lower low somewhere in the future. It is always good to look at markets from different perspectives.

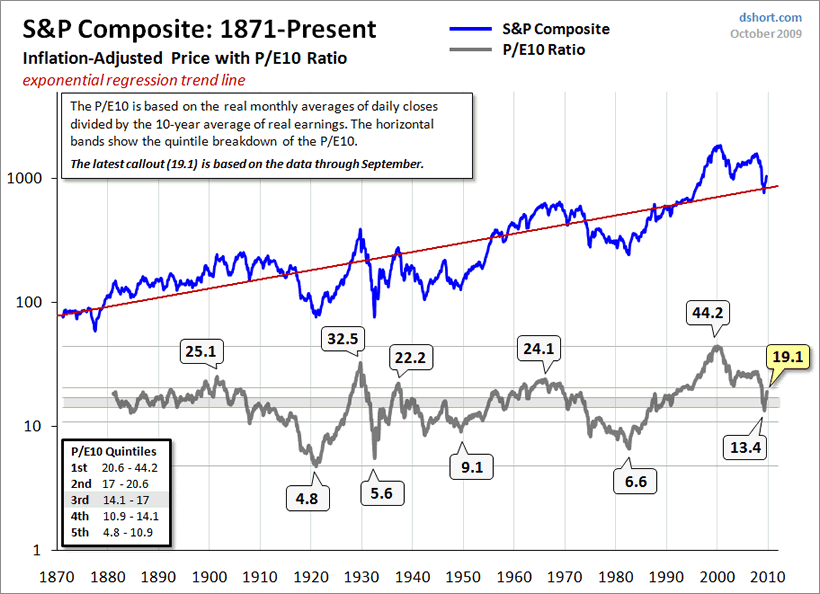
The third chart shows the long term price to earning ratios and where we currently stand. Major bottoms register PE ratios in the fifth quintile of 4.8 to 10.9. We bottomed at 13.4 and currently stand at 19.1. Incidentally at 20.6 we are in the 1st quintile.

Enjoy this article? Like to receive more like it each day? Simply click here and enter your email address in the box below to join them.
Email addresses are only used for mailing articles, and you may unsubscribe any time by clicking the link provided in the footer of each email.
Charles Maley
www.viewpointsofacommoditytrader.com
Charles has been in the financial arena since 1980. Charles is a Partner of Angus Jackson Partners, Inc. where he is currently building a track record trading the concepts that has taken thirty years to learn. He uses multiple trading systems to trade over 65 markets with multiple risk management strategies. More importantly he manages the programs in the “Real World”, adjusting for the surprises of inevitable change and random events. Charles keeps a Blog on the concepts, observations, and intuitions that can help all traders become better traders.
© 2005-2022 http://www.MarketOracle.co.uk - The Market Oracle is a FREE Daily Financial Markets Analysis & Forecasting online publication.


