


This S&P 500 Chart Tells the Two-Part Truth
Stock-Markets / Stocks Bear Market Nov 04, 2009 - 10:34 AM GMTBy: EWI

 Have you seen or read ANYTHING like this in the past two weeks?
The following text is courtesy of Elliott Wave International. Until Nov. 11, EWI is allowing non-subscribers to download their latest market analysis and forecasts for free, including Robert Prechter's latest Elliott Wave Theorist and Steve Hochberg's and Pete Kendall's latest Elliott Wave Financial Forecast. Learn more about FreeWeek, and download your free reports here.
By Robert Folsom, Senior Writer for Elliott Wave International
As you read and look at this page, please know that the chart is the star of the show. My description will add only a few details.
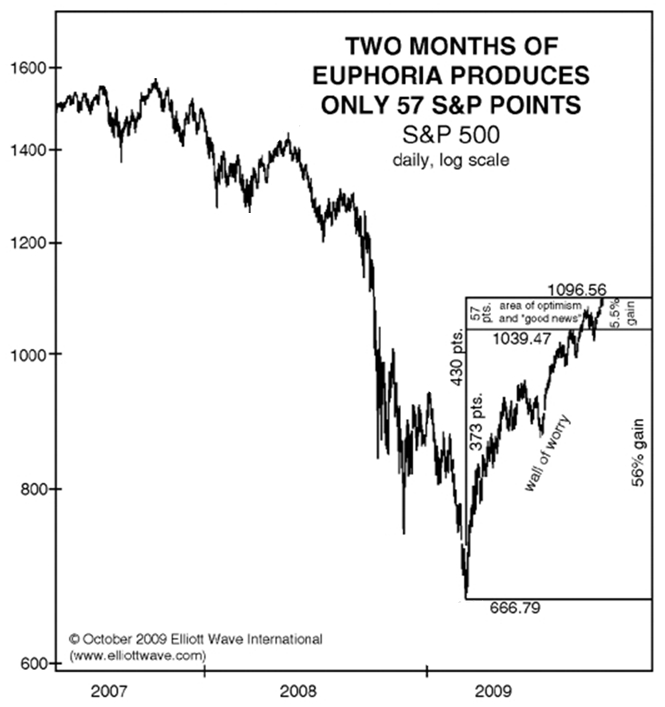
The chart published less than two weeks ago in Bob Prechter's Elliott Wave Theorist. The rectangular box is plain to see: It envelopes the huge S&P 500 rally that began last March -- a gain of 61.5% and 430 points, as of Oct. 18.
But there's a two-part truth to the rally -- and that is what the box really shows.
Part one shows the "wall of worry" -- basically March through August. That's when the media and experts were overwhelmingly negative about stocks. They were surprised by the rally. Remember?
Part two shows the more recent time of "euphoria" -- basically September and October. The media and experts turned positive. The market was all about "green shoots" and "recovery."
You see when most of the rally unfolded. Six months of serious worry produces a 373-point climb, whereas "two months of euphoria produces only 57 S&P points."
Now, the two-part truth about this rally is an easy story to tell. It's literally a few lines and notations on a price chart. Yet have you seen or read ANYTHING like this in the past two weeks? Has anyone else pointed out that over the past two months, the stock market "rally" has in fact slowed to a crawl?
As you looked at the chart, perhaps you noticed that the decline, which began in 2007, and in turn the recent rally, are both on a similarly large scale. The full version of this chart shows how important that "similarity of scale" really is (Elliott labels were excluded in consideration of Theorist subscribers).
Price action in the stock market this week has only strengthened the analysis in Bob Prechter's October Theorist issue.
What's more, you can read the very latest forecasts in the just-published November issue of the Elliott Wave Financial Forecast -- both publications (plus the tri-weekly Short Term Update) are yours for free -- only during FreeWeek (now through Nov. 11).
Learn more about FreeWeek, and download the November Theorist for more about the above chart.Robert Folsom is a financial writer and editor for Elliott Wave International. He has covered politics, popular culture, economics and the financial markets for two decades, via print, radio and the Internet. Robert earned his degree in political science from Columbia University in 1985.
© 2005-2022 http://www.MarketOracle.co.uk - The Market Oracle is a FREE Daily Financial Markets Analysis & Forecasting online publication.