


Three Bearish Stock Market Breadth Charts You Won't See Anywhere Else
Stock-Markets / Stocks Bear Market Nov 13, 2009 - 01:55 AM GMTBy: Guy_Lerner

 Figure 1 is a daily chart of the S&P500 (symbol: $INX). The indicator in the bottom panel comes from mathematician James Meikka. Meikka developed a formula to measure advancing and declining issues that prevents drift and forces it to maintain a consistent relationship with the zero line. It is like a McClellan Summation Index. Instead of applying the indicator to advancing and declining issues, I am utilizing NYSE up volume versus down volume in figure 1 (the data is hidden). So my indicator in the lower panel is a measure of advancing volume versus declining volume.
Figure 1. SP500/ daily
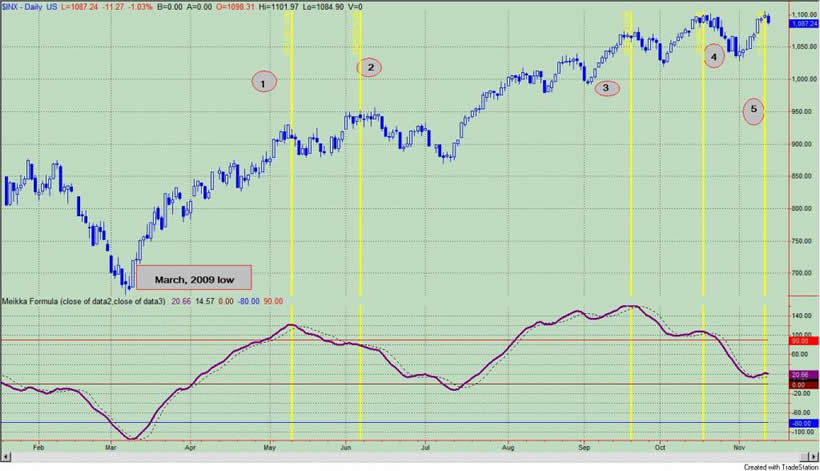
The March, 2009 low is noted in figure 1. Point 1 shows the peak of the initial thrust from the March low. Both price and our volume indicator made new highs. At point 2, price made a new high, but the indicator did not; this is a negative divergence that led to price weakness over the next 4 weeks. Point 3 shows that price and the volume indicator made new highs together, but starting with point 4, price made a new high but the indicator has started to lag. Point 5 is another new high but the indicator remains way below its mid-September peak. My interpretation: stocks in the NYSE are not receiving the sponsorship to justify the recent highs in the index.
Figure 2 is a weekly chart of the S&P500 (symbol: $INX), and the indicator in the bottom panel shows the percentage of NYSE stocks trading above their 40 day moving average. While prices are making new highs this past week, the number of stocks trading above their 40 week moving average continues to hover around 50%; furthermore, the trend from the March low has been broken. My interpretation: another sign of weakness as the rally narrows; there is weakness under the surface.
Figure 2. SP500/ weekly
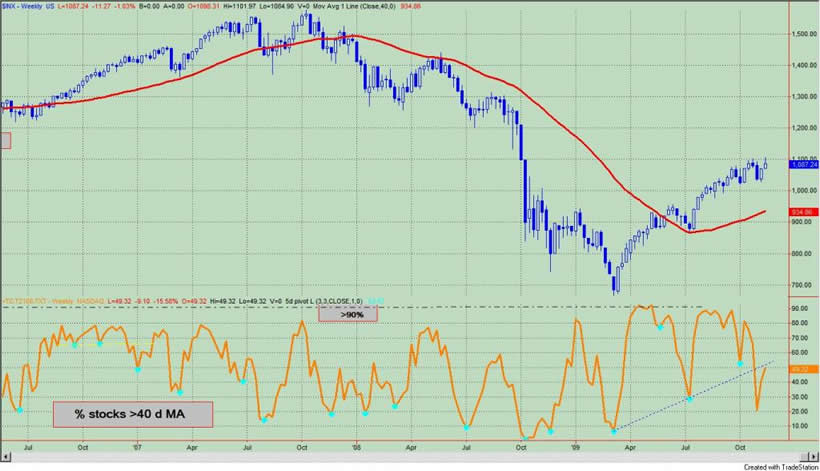
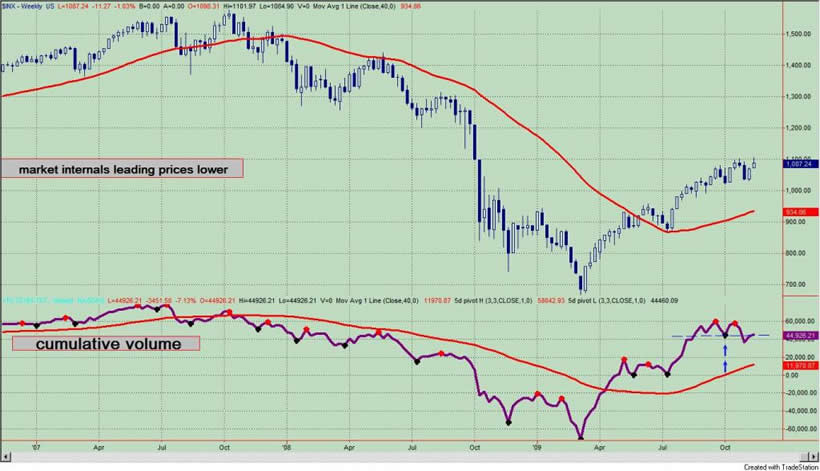
Figure 3 is a weekly chart of the S&P500 (symbol: $INX) with the NYSE cumulative volume index in the lower panel, which comes from the Worden Brothers software. The pivot low point identified with the blue up arrows remains the "line in the sand". The current value is very close to closing below this pivot point, and in essence, this would represent a bearish signal. Typically, there is a tight correlation between cumulative volume and price, and the situation here once again suggests internal market weakness. I will keep you posted on this chart!
Figure 3. SP500/ weekly
By Guy Lerner
http://thetechnicaltakedotcom.blogspot.com/
Guy M. Lerner, MD is the founder of ARL Advisers, LLC and managing partner of ARL Investment Partners, L.P. Dr. Lerner utilizes a research driven approach to determine those factors which lead to sustainable moves in the markets. He has developed many proprietary tools and trading models in his quest to outperform. Over the past four years, Lerner has shared his innovative approach with the readers of RealMoney.com and TheStreet.com as a featured columnist. He has been a regular guest on the Money Man Radio Show, DEX-TV, routinely published in the some of the most widely-read financial publications and has been a marquee speaker at financial seminars around the world.
© 2009 Copyright Guy Lerner - All Rights Reserved
Disclaimer: The above is a matter of opinion provided for general information purposes only and is not intended as investment advice. Information and analysis above are derived from sources and utilising methods believed to be reliable, but we cannot accept responsibility for any losses you may incur as a result of this analysis. Individuals should consult with their personal financial advisors.
Guy Lerner Archive |
© 2005-2022 http://www.MarketOracle.co.uk - The Market Oracle is a FREE Daily Financial Markets Analysis & Forecasting online publication.