


U.S. Unemployment Projected Scenarios For the Next 10 Years
Economics / UK Economy Nov 16, 2009 - 05:42 AM GMTBy: Mike_Shedlock

 Last week in Mish Unemployment Projections Through 2020 I posted a chart and tables of what unemployment might look like in what is best described as an optimistic "muddle through" scenario with no recessions for another decade.
Still even with those optimistic projections I came up with this grim chart of unemployment projections.
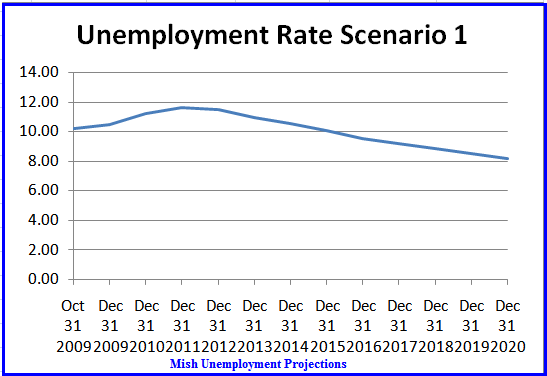
Unemployment Scenario 1 Data
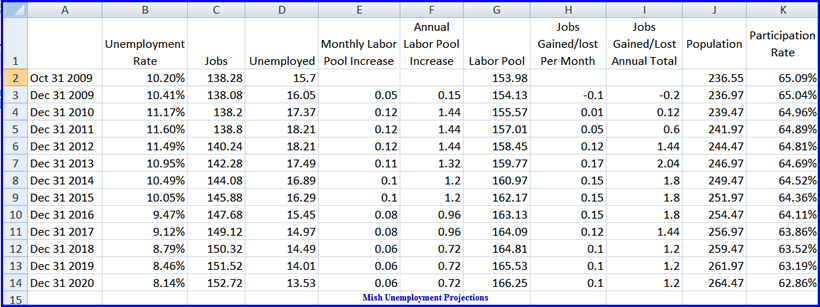
Downloadable Spreadsheet
Shortly after writing the above article, I received a call form John Mauldin asking if I would post the spreadsheet so people could make their own assumptions and projections about how fast the economy would add jobs.
I thought that was a good idea so I added an addendum to my post.
You can download the spreadsheet and change parameters for the monthly average number of jobs the economy will create, and the number of monthly jobs required just to keep up with the birthrate and immigration and the spreadsheet will produce a chart of what the unemployment rate will look like for your assumptions.
See the addendum in the above link for table usage notes and download instructions.
Mauldin's Scenarios
John Mauldin and I did some playing around over the phone and he mapped out two additional scenarios, one of them a double dip scenario and the second an extremely optimistic scenario.
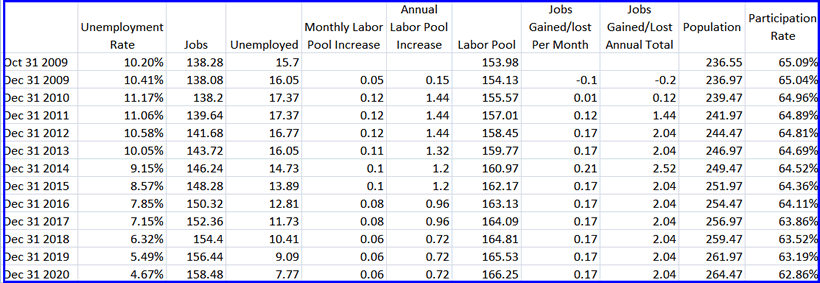
Let The Good Times Roll
You can see what John came up with in If This is Recovery…
What would it take to get back to 5% unemployment? I played with the spreadsheet and came up with the following numbers, which get us below 5% by 2020. I assume no recessions for the next ten years, and 2 million new jobs a year after 2011, which I start off with almost 1.5 million jobs. Of course, we have never done that, but let’s be optimistic.
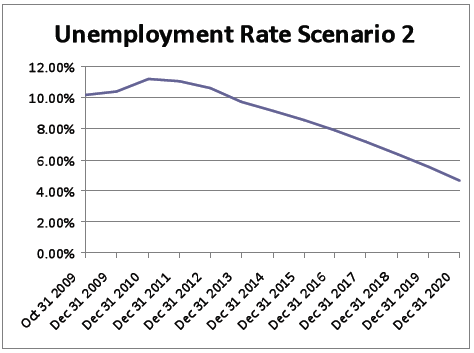
And the graph below shows the unemployment numbers for the Good Times Scenario.
Under John's extremely optimistic jobs creation forecast, unemployment is still above 8% at the end of 2015. Please note that John is not calling for that to happen, instead we played around to see just what it would take to get unemployment to 5% by the end of 2020.
Also note the optimistic assumptions as to how many jobs it would take keep up with the birth rate and immigration. In 2013 we assumed we would only need 110,000 jobs to keep up with population growth, and only 80,000 jobs a month for 2016-2017, and then a mere 60,000 jobs a month all the way through 2020.
That is making some pretty optimistic assumptions about boomers retiring, no longer looking to work.
Of course, boomers might need to work and want to work, but be too discouraged to look for work. In that case, the effect would show up in U-6 unemployment not U-3 (the official unemployment rate) that the spreadsheet maps.
John also mapped a mild double-dip scenario, yet one in which the economy come roaring back immediately afterwards.
Inquiring minds will want to take a look at John's assumptions and also to see he has to say about sales tax data.
Mildly Pessimistic Scenario
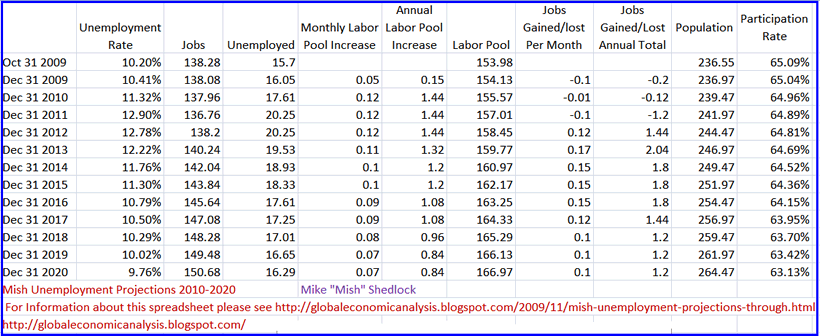
Let's see what happens on a mildly pessimistic scenario. I will assume a mild-double dip, followed by reasonably strong growth, no additional recessions through 2020, but with a slightly less optimistic forecast on how many jobs are needed to keep up with birthrate and immigration.
For this scenario I assumed a mild double dip where 100,000 jobs a month would be lost, followed by job gains of 120,000, then 170,000, then 150,000 for three years before tapering off. I also decreased the participation rate (indirectly), by assuming the number of jobs needed to keep employment steady would drop a bit slower from 110,000 in 2013 to 70,000 in 2020.
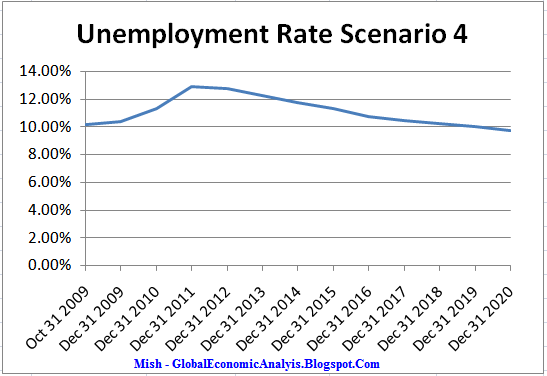
Mildly Pessimistic Chart
Is that possibility so unrealistic? I think not, yet look at the result: Unemployment does not dip below 10% until 2020.
Please download the spreadsheet (available in the top link), read my assumptions, then factor in your own assumptions about job growth, outsourcing, productivity, stimulus plans, housing, etc., whatever you want and see for yourself just how hard it will be to get unemployment under 8%, let alone under 6%.
Remember back a decade or so ago when economists thought it was not possible to have unemployment below 7% without a lot of inflation. What if they were correct and the 5% we have had this decade was an outlier? Is that so farfetched?
If after playing around with the spreadsheet you come to the conclusion that we are going to have structurally high unemployment for a decade, I believe you have come to the right conclusion.
By Mike "Mish" Shedlock
http://globaleconomicanalysis.blogspot.com
Click Here To Scroll Thru My Recent Post List
Mike Shedlock / Mish is a registered investment advisor representative for SitkaPacific Capital Management . Sitka Pacific is an asset management firm whose goal is strong performance and low volatility, regardless of market direction.
Visit Sitka Pacific's Account Management Page to learn more about wealth management and capital preservation strategies of Sitka Pacific.
I do weekly podcasts every Thursday on HoweStreet and a brief 7 minute segment on Saturday on CKNW AM 980 in Vancouver.
When not writing about stocks or the economy I spends a great deal of time on photography and in the garden. I have over 80 magazine and book cover credits. Some of my Wisconsin and gardening images can be seen at MichaelShedlock.com .
© 2009 Mike Shedlock, All Rights Reserved
Mike Shedlock Archive |
© 2005-2022 http://www.MarketOracle.co.uk - The Market Oracle is a FREE Daily Financial Markets Analysis & Forecasting online publication.