Are U.S. Treasury Bond Yields Headed Lower?
Interest-Rates / US Bonds Nov 16, 2009 - 08:57 AM GMTBy: Guy_Lerner
 I am beginning to see signs that there is a high likelihood of this occurring over the next couple of weeks. Figure 1 is a weekly chart of the Ultra Short Lehman 7-10 Year Treasury (symbol: PST); this is an ETF that corresponds to the inverse of the daily performance of the Barclays Capital 7-10 Year U.S. Treasury index.
In other words, it moves in the direction of Treasury yields. With Friday's close, PST is now trading below 3 pivot low points, and as I have shown in the Dollar Index (and observed with other assets) this is a very ominous pattern. In the figure, I have labeled the 3 pivot low points. A weekly close back above pivot 1 at 52.89 would violate this pattern.
Figure 1. PST/ weekly

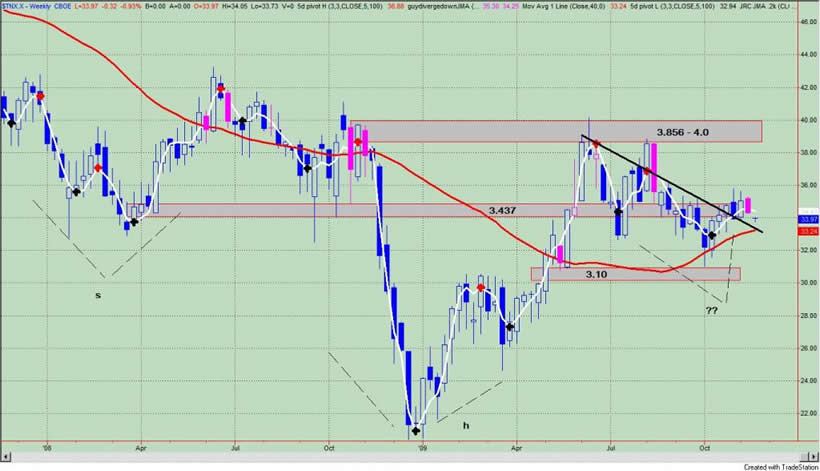
Figure 2 is a weekly chart of the yield on the 10 year Treasury (symbol:$TNX.X), and this is the same graph that I showed on October 9, 2009, when we last reviewed the technical picture. The key pivotal area appears to be around a yield of 3.437%. Yields are currently below this area after a brief foray above. However, yields do remain above the 40 week moving average and the down sloping black trend line (both positives). Failure to remain above the pivot low point at 3.437% is the first sign of weakness in Treasury yields.
Figure 2. $TNX.X/ weekly

I believe the implications of lower Treasury yields are noteworthy as it implies a deflationary environment and slowing economy. Lower Treasury yields typically signal the peak in equities especially during bear market rallies. See the article: "David Rosenberg: This Is Your Last Chance". Of course, a continued deflationary environment could be interpreted as giving policy makers (i.e., the Federal Reserve) carte blanche with regards to money creation. Economic weakness implies ongoing Fed stimulus and Dollar destruction; this would be an equity positive. Of course, these trends cannot go on forever without ill towards effect. We are seeing signs of exhaustion in equities and the Dollar is near support last seen in early, 2008.
By Guy Lerner
http://thetechnicaltakedotcom.blogspot.com/
Guy M. Lerner, MD is the founder of ARL Advisers, LLC and managing partner of ARL Investment Partners, L.P. Dr. Lerner utilizes a research driven approach to determine those factors which lead to sustainable moves in the markets. He has developed many proprietary tools and trading models in his quest to outperform. Over the past four years, Lerner has shared his innovative approach with the readers of RealMoney.com and TheStreet.com as a featured columnist. He has been a regular guest on the Money Man Radio Show, DEX-TV, routinely published in the some of the most widely-read financial publications and has been a marquee speaker at financial seminars around the world.
© 2009 Copyright Guy Lerner - All Rights Reserved
Disclaimer: The above is a matter of opinion provided for general information purposes only and is not intended as investment advice. Information and analysis above are derived from sources and utilising methods believed to be reliable, but we cannot accept responsibility for any losses you may incur as a result of this analysis. Individuals should consult with their personal financial advisors.
Guy Lerner Archive |
© 2005-2022 http://www.MarketOracle.co.uk - The Market Oracle is a FREE Daily Financial Markets Analysis & Forecasting online publication.


