MSCI Emerging Market Index Fund Key Price Levels
Stock-Markets / Emerging Markets Jan 26, 2010 - 09:48 AM GMTBy: Guy_Lerner
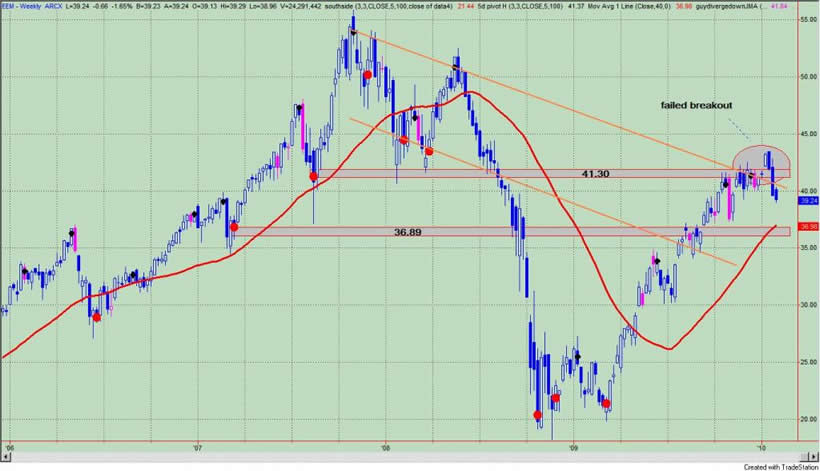
Figure 1 is a weekly chart of the i-Shares MSCI Emerging Market Index Fund. This is the third largest ETF in the market with $39 billion of assets.
Figure 1. EEM/ weekly

Before breaking down EEM, let me set up the chart. The pink labeled price bars are negative divergence bars between price and an oscillator that measures price, and as we know, a cluster of these negative divergence bars is consistent with waning price momentum. The red dots are key price points, which are points where buying and selling are most likely to take place.
The first technical tidbit is the clustering of negative divergence bars leading to a market top. A close above the highs of these negative divergence bars suggested a blow off or an acceleration in price, but this breakout has turned into a nasty fake out.
The second technical tidbit to notice is the failed breakout; see the oval on the price chart. At the end of 2009, prices broke above the 41.30 price level and out of the down sloping trend channel. Over the last two weeks, prices have reversed sharply such that we are back within the trend channel and back below support at 41.30. Support now becomes resistance (which is at 41.30). On the downside, look for EEM to firm up at the next level of support, which comes in around $37. This also happens to coincide with a rising 40 week moving average.
By Guy Lerner
http://thetechnicaltakedotcom.blogspot.com/
Guy M. Lerner, MD is the founder of ARL Advisers, LLC and managing partner of ARL Investment Partners, L.P. Dr. Lerner utilizes a research driven approach to determine those factors which lead to sustainable moves in the markets. He has developed many proprietary tools and trading models in his quest to outperform. Over the past four years, Lerner has shared his innovative approach with the readers of RealMoney.com and TheStreet.com as a featured columnist. He has been a regular guest on the Money Man Radio Show, DEX-TV, routinely published in the some of the most widely-read financial publications and has been a marquee speaker at financial seminars around the world.
© 2010 Copyright Guy Lerner - All Rights Reserved
Disclaimer: The above is a matter of opinion provided for general information purposes only and is not intended as investment advice. Information and analysis above are derived from sources and utilising methods believed to be reliable, but we cannot accept responsibility for any losses you may incur as a result of this analysis. Individuals should consult with their personal financial advisors.
Guy Lerner Archive |
© 2005-2022 http://www.MarketOracle.co.uk - The Market Oracle is a FREE Daily Financial Markets Analysis & Forecasting online publication.


