Week of U.S. Treasury Bond Failures
Interest-Rates / US Bonds Mar 26, 2010 - 03:32 PM GMTBy: Shaily
 The week of March 21-26, 2010 will be remembered for the worst week for Bond auctions. Yields on 10 year shot up to levels seen in June 2009. 10-year notes touched the highest levels since June amid heightened concerns about the government’s ability to finance its deficits and as investors turn to seeking out higher yields in other asset classes.
Analyzing this week auction results could be crucial to understand what lies ahead.
We will only look at the 7 year UST 5 Year UST and 2 Year UST auctions held this week.
7 Year UST auctions
Treasury continues to see tepid demand for its bonds. Bids came in at 2.6 Bid/cover while yield stayed at elevated levels of 3.374%.
The Treasury Department sold $32 billion in 7-year notes (UST7YR 3.31, +0.02, +0.61%) on Thursday at a yield of 3.374%, higher than traders anticipated. Bidders offered to buy $2.61 for every $1 of debt being sold, compared to an average of $2.83 at the last four sales, all for the same amount. Indirect bidders, a group that includes foreign central banks, bought 41.9%, versus an average of 49.7% of the last four. Direct bidders, a class that includes domestic money managers, purchased another 8.1%, compared to 11.3% on average. In the broader market, long-term bond yields, which move inversely to prices, turned higher before the auction results were released. Yields on 10-year notes (UST10Y 3.87, +0.02, +0.49%) rose 3 basis points to 3.89%, after jumping by the most since last summer on Wednesday.
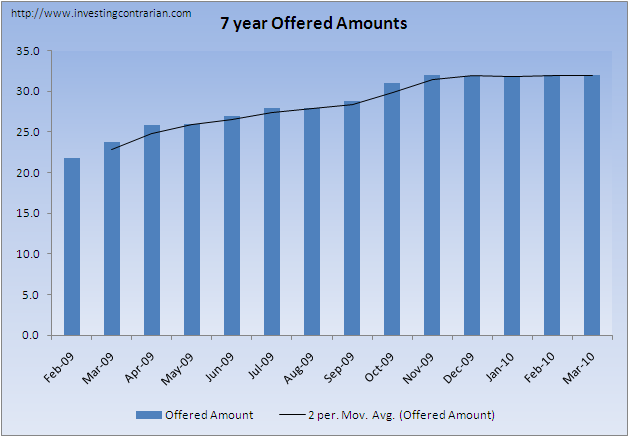
The size of issue was 32bn same as last month.

Bid/cover to came in 2.61, far lower than the 3.0 observed in February. Indirect bidders picked up 41% marginally above February 40% while the direct bidders stayed away and only accounted for 8% as against 17% last month. Dealers took the big chunk of 50%.

We are moving faster down the hill to the meltdown. Fasten your seat belts.
To read last month 7 year UST demand, click here
5 Year UST auctions
Offered Amount: $42
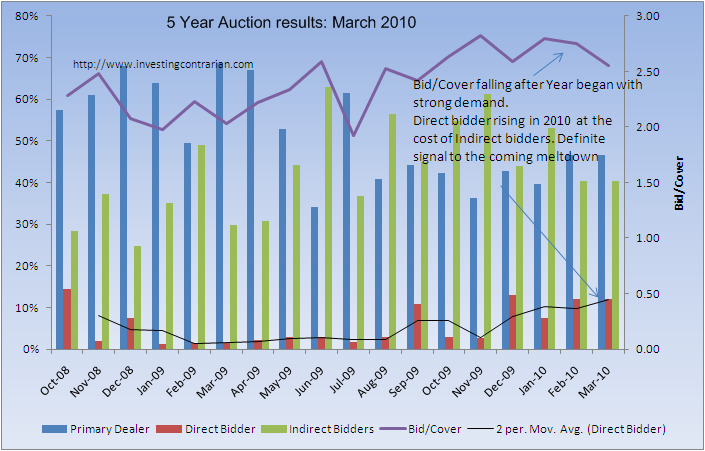
Bid/Cover: 2.55
Marketwatch reports:
The Treasury Department sold $42 billion in 5-year notes (UST5YR 2.49, +0.08, +3.40%) on Wednesday at 2.605%, higher than traders had anticipated. Bidders offered to buy 2.55 times the amount debt being sold, the lowest since September. That metric of investor demand also compares to 2.74 times on average at the last four sales of the securities, all for the same amount. Indirect bidders — a class of investors that includes foreign central banks — bought 39.6% of the offering, compared to an average of 49.6% of recent sales and the lowest since July. Direct bidders, including domestic money managers, purchased another 10.8%, versus 9% on average. After the auction, yields remained sharply higher in the broader government-bond market as corporate and other higher-risk debt drew investors away from Treasurys. Yields on 10-year notes, (UST10Y 3.79, +0.11, +2.85%) , which move inversely to prices, rose 13 basis points to 3.81%.
The graph below illustrates the FED mechanism t o hide the lack of demand for its crap by showing strong demand through Direct bidders. For sure, it does seem the Asian Giants are growing tired of the week after week of unbelievably large amount of supply.

The offered amount is rising by every auction.

Does the apparent lack of demand from China in any way explain the latest aggressive posturing by the US concerning Currency Manipulation? I think so.
2 Year UST Auction
The offered amount was a massive $44 billion. This is in keeping with the recent spate of 30 Year bonds demand flailing which is making the FED to force increase short duration bonds. But even that is now under attack as indirect bids softened and yields ticked 1 bps over the expected.
Demand was moderate for the Treasury’s monthly 2-year note auction, a very large $44 billion offering that posted a soft bid-to-cover ratio of 3.00 vs. a 3.19 average over the last six auctions, all of them $44 billion in size. In a sign of weakness, the high yield of 1.000 percent was nearly 1 basis point over expectations. Dealers ended up holding this issue as non-dealers took down only 45.6 percent of the auction, well under the 55.8 percent average going back to June. Direct bidding by non-dealers, at 13.8 percent, was heavy but not extreme. The Treasury auctions $42 billion of 5-year notes on Wednesday followed by $32 billion of 7-year notes on Thursday.
We do not see any immediate threat to 2 year bonds sale.
The first signs of the meltdown in bond market will be seen in the 30 year which we have termed as failure for 2010 as all three auctions have been under stress.
Source: http://investingcontrarian.com/bonds/week-of-bond-failures/
Shaily
http://investingcontrarian.com/
Shaily is Editor at Investing Contrarian. She has over 5 year experience working with Hedge funds in derivatives.
© 2010 Copyright Shaily - All Rights Reserved
Disclaimer: The above is a matter of opinion provided for general information purposes only and is not intended as investment advice. Information and analysis above are derived from sources and utilising methods believed to be reliable, but we cannot accept responsibility for any losses you may incur as a result of this analysis. Individuals should consult with their personal financial advisors.
© 2005-2022 http://www.MarketOracle.co.uk - The Market Oracle is a FREE Daily Financial Markets Analysis & Forecasting online publication.


