


It’s Not So Simple, Witnessing a Stock Market Bull Trap
Stock-Markets / Stock Markets 2010 Apr 09, 2010 - 12:58 PM GMTBy: Brian_Bloom

 The weekly chart below of the Dow Jones industrial Index (courtesy Bigcharts.com) shows rising prices on declining volume. Typically, this is bearish sign and should be treated as a serious warning.
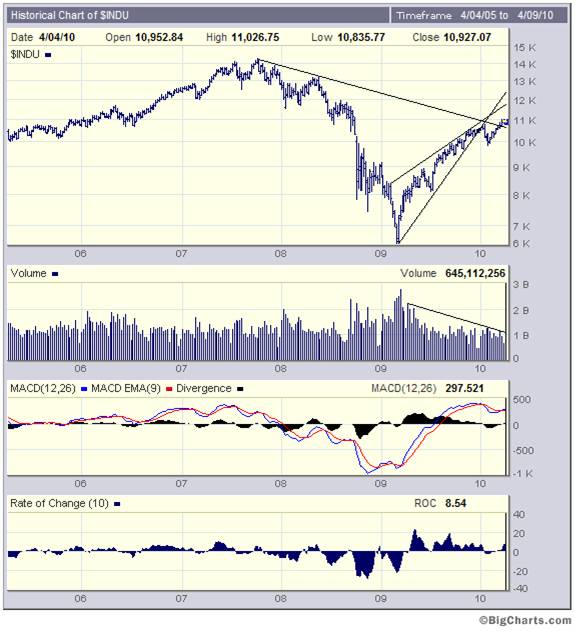
Following the breakdown from a rising wedge, the price “should” head south. On rare occasions, this analyst has seen a break up from a rising wedge but there were two accompanying situations:
- The Primary Trend was invariably bullish
- The break up was accompanied by RISING volume
So, the first question is: Are we in a Primary Bull Market
According to Dow Theory, two conditions precedent need to be satisfied for a bull market to prevail:
- Both the Industrials and the Transport Index must have risen to higher highs
- Prices must represent good value – as measured by Dividend Yield. (preferably >5%)
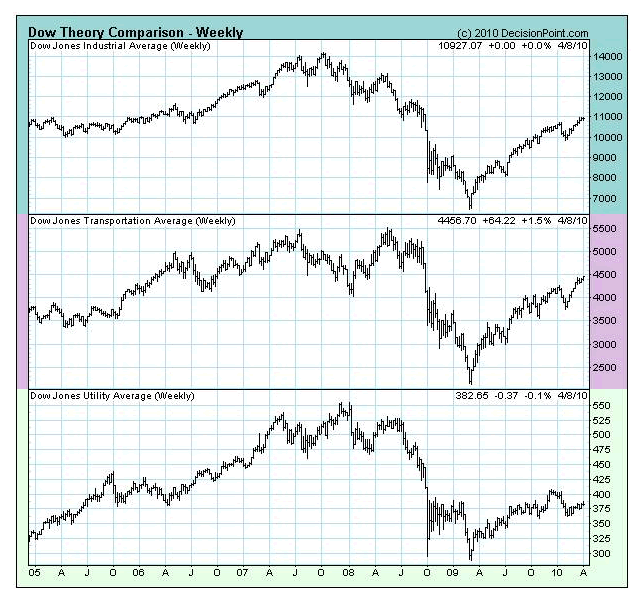
Let’s have a look at Dow Theory from the perspective of 1 above
The chart below, courtesy DecisionPoint.com shows that both the Industrials and the Transports have indeed risen to higher highs.
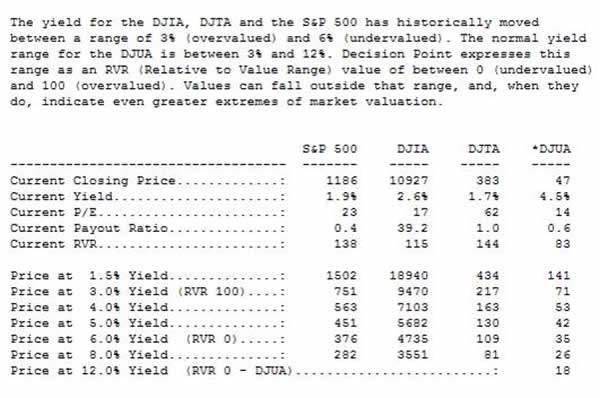
Unfortunately, it’s not as simple as that. Values need to confirm.
The following is reproduced from the DecisionPoint website. Note that in terms of the DecisionPoint RVR, the Dow is overvalued and the transports are 44% “over the top” (possibly because the oil price is in a bull trend and demand for transport is relatively inelastic at the core). Note also that the SPX is 38% “over the top”
There is a “weight of money” argument which says that price is a function of demand and that demand is driven by money supply more than by value in today’s market.
If you believe that argument, then you will make money up to the point that you lose it again. Ultimately, the secret to making profits in business is to buy low and sell high and the “high” and “low” are ultimately determined by value relative to alternatives. A bottle of water at $5 represents low value for money in a supermarket but it might represent great value for money in a desert.
The other alternative is to trade in and out where your decisions are based on the greater fool theory. “I don’t care what the underlying value is; the market is telling me that I will be able to sell at a higher price than I paid to a greater fool”.
In this analyst’s view, that is what we have been witnessing since March 2009.
Here is a quote from Ben Bernanke in today’s media: ““To avoid large and unsustainable budget deficits, the nation will ultimately have to choose among higher taxes, modifications to entitlement programs such as Social Security and Medicare, less spending on everything else from education to defense, or some combination of the above”. (Source: http://www.totalmortgage.com/blog/mortgage-rates/bernanke-warns-of-dangers-posed-by-deficit/2807 )
When thinking about the implications of this statement, we should remember that (until the introduction of the stimulus package and its temporary impact on the economy) upwards of 70% of the US GDP was accounted for by consumer spending.
Why do I emphasize the word “temporary”?
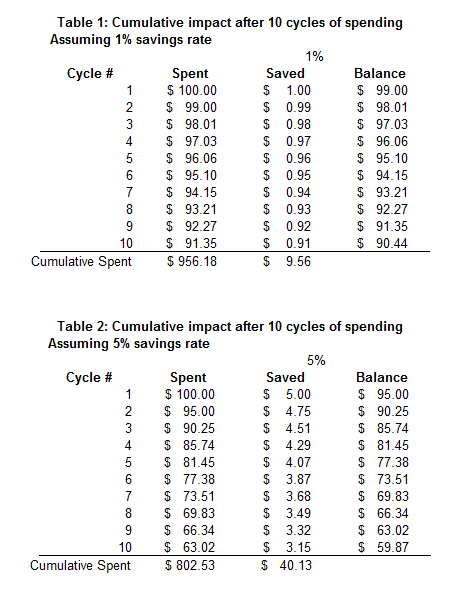
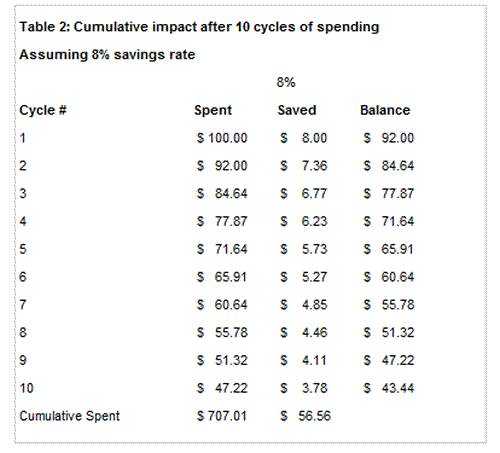
Because the economic multiplier assumes that one dollar will be spent and on spent. But, the reader hereof is advised to study the two tables below with great care. When the savings rate rises, the economic multiplier becomes less potent.
The personal savings rate in the USA has been doing this:
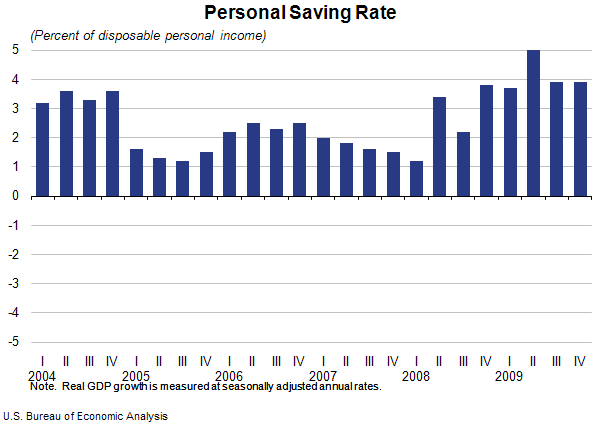
Source: http://www.bea.gov/BRIEFRM/SAVING.HTM
But there is also another dimension to the equation. There is a question as to how “debt repayment” is classified in the statistics – in particular credit card repayments.
Here is a quote relating to a recent Price Waterhouse Cooper survey:
Recent research by accountancy firm PricewaterhouseCoopers has predicted that up to 9% of all credit card balances could be bad debt by the end of 2010.
This would represent a significant increase in the levels of bad credit card debt on the current figure of around 6%, and is despite an 8% drop in the number of credit cards in issue, and a 3% reduction in credit card borrowing in the last year.
If a 3% reduction in credit card borrowing was classified as “savings” and, assuming this is not included in the 5% savings, then the true savings rate would be closer to 8%. This is the impact on the multiplier of an 8% savings rate:
Now, another way of looking at the multiplier effect would be to look at the velocity of money. How often does the stock of money turn over?
If we divide GDP by (say) M2 then we get the velocity of M2 money in a single year.
GDP of the US in 2008 was $14.2 trillion
M2 in the US was $8.239 trillion (source: http://www.federalreserve.gov/releases/h6/Current/ )
So the number of times that the stock of money turned over in 2008 was 14.2/8.239 = 1.72X
Lets say – for the sake of simplicity – that the velocity of money was 2X i.e. That the stock of money turns over twice in one year. That would imply that any incremental money injected into the system would also turn over twice in one year – i.e. the “multiplier” would also be 2X.
Now have a look at the number under “balance” in Cycle #2 in Table #3. It reads $84.64.
If the US consumer accounted for 100% of the US economy (and assuming no inflation) then NOMINAL GDP would have dropped by 15.36% because of the higher savings rate and assuming no stimulus.
Lets take 70% of that number. That would be 10.75%
Of course, all of the above is highly simplistic. Nevertheless, it serves to illustrate that the government’s stimulus package (which would have been around 10% of US GDP assuming it was all spent in one year and it turned over twice) could not fully offset the impact of increased savings. It merely served to soften the blow and the economy still contracted in real terms.
But, and it’s a big but, Once the stimulus has worked its way through the system, the GDP will only get back to previous levels if:
- Unemployment shrinks to previous levels – (it has actually risen in the past year)
- Personal savings rates fall to previous levels – (it may still be rising given the contraction in Credit Card borrowing)
- Velocity of money rises to previous levels – it may still be contracting because of 1 and 2 above
- Failing the above, there is another stimulus
Conclusion
Based on Bernanke’s statement it is clear that there will not be a second stimulus package. Therefore, logic dictates that the US GDP will struggle to grow in the foreseeable future. In this context, given the (apparent) technical strength of the stock market indices and given the absence of underlying value as defined by dividend yield, the stock market is now populated by gamblers who have no fundamentally defensible basis for justifying their decisions to remain invested. They are relying purely on the base assumption that there will inevitably be a greater fool out there. The problem is that when a serious sell signal manifests – which will inevitably happen if/when the price of money rises – the pool of greater fools will suddenly dry up, thereby exposing the leveraged investor as the greatest fool of all.
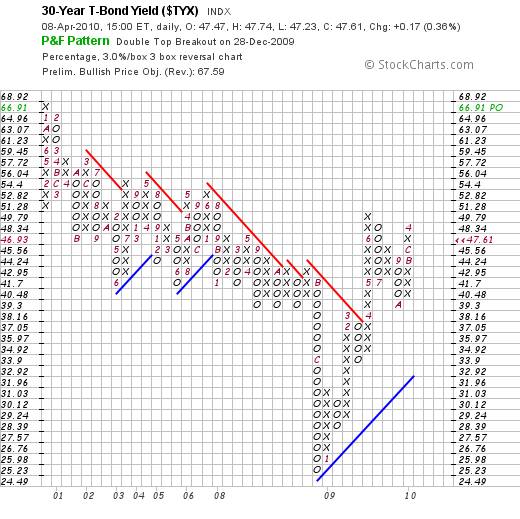
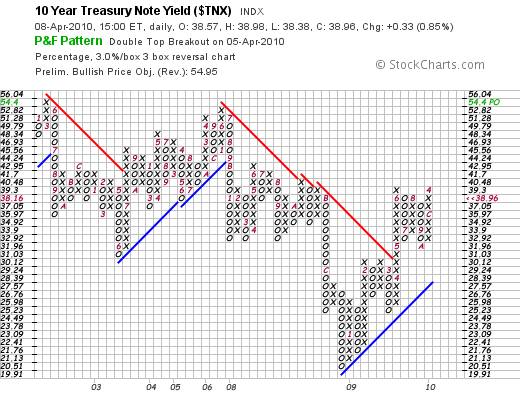
Below, courtesy stockcharts.com are Point and Figure Charts of the 30 year treasury yield and the 10 year treasury yield – sensitized to reflect only moves of 3%.
The 30 year yield gave a buy signal (indicating higher yields expected) on December 28th 2009 and the ten year yield gave a buy signal on April 4th 2010.
By Brian Bloom
Once in a while a book comes along that ‘nails’ the issues of our times. Brian Bloom has demonstrated an uncanny ability to predict world events, sometimes even before they are on the media radar. First he predicted the world financial crisis and its timing, then the increasing controversies regarding the causes of climate change. Next will be a dawning understanding that humanity must embrace radically new thought paradigms with regard to energy, or face extinction.
Via the medium of its lighthearted and entertaining storyline, Beyond Neanderthal highlights the common links between Christianity, Judaism, Islam, Hinduism and Taoism and draws attention to an alternative energy source known to the Ancients. How was this common knowledge lost? Have ego and testosterone befuddled our thought processes? The Muslim population is now approaching 1.6 billion across the planet. The clash of civilizations between Judeo-Christians and Muslims is heightening. Is there a peaceful way to diffuse this situation or will ego and testosterone get in the way of that too? Beyond Neanderthal makes the case for a possible way forward on both the energy and the clash of civilizations fronts.
Copies of Beyond Neanderthal may be ordered via www.beyondneanderthal.com or from Amazon
Copyright © 2010 Brian Bloom - All Rights Reserved
Disclaimer: The above is a matter of opinion provided for general information purposes only and is not intended as investment advice. Information and analysis above are derived from sources and utilising methods believed to be reliable, but we cannot accept responsibility for any losses you may incur as a result of this analysis. Individuals should consult with their personal financial advisors.
Brian Bloom Archive |
© 2005-2022 http://www.MarketOracle.co.uk - The Market Oracle is a FREE Daily Financial Markets Analysis & Forecasting online publication.