


Today’s Most Important Gold Price Points
Commodities / Gold and Silver 2010 Apr 30, 2010 - 03:01 PM GMTBy: Bill_Downey

 Ever since the price high of 1227 in December, gold has been in a trading range. The most recent rally has brought gold to the upper ceiling of that trading range and the question now is whether this move will propel gold higher and above the trading range, whether we in for more sideways action or a seasonal correction.
To better understand where gold currently stands in this “The 21st Century Gold Bull Market”, a look at the entire bull market to date will give us a good understanding and appreciation for where gold finds itself today. Let’s look at three views.
We will begin with a five month perspective of gold.
This view demonstrates that gold has remained strong even during a correction.
For five months gold has been going sideways and has yet to establish a downtrend. The three blue dots at the bottom of the chart suggest that gold has potentially formed a strong base from which to attempt a continuation of the current rally.
The recent price pullback to the orange downtrend line, while remaining above the support of the blue and red 34 and 13 day moving averages, is a second indication that bodes well for a continuation of this rally. As long as price holds above this recent area the most likely move now is to the white channel line at 117 in GLD (1200 in Gold). And there is a potential for further price appreciation should gold move above that white trend line.
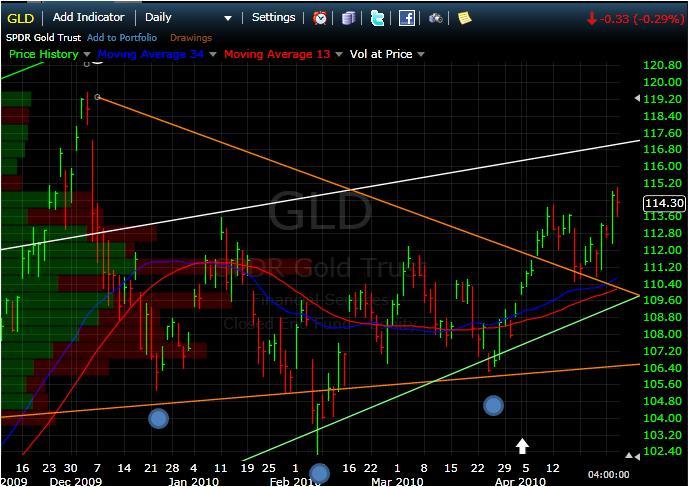
There is one observation about this latest rise that is different than the corrective phases in January and March. And that is the blue 34 day moving average is above the red 13 day moving average. This momentum strength tends to favor a bullish outcome.
Wednesday’s GLD price low on the daily bar (113.63) was at the same spot as the price high of January 11th. This is significant because gold is at the point where the bears either hold price in place or the bulls will run price up to 117 (1200 in gold).
As the closing price for the month of April will be decided this Friday, there is a lot of incentive for both sides to try to control price for the next couple days. I believe this is the most important price test for gold so far this year.
In order to better understand just how important current price is on the first chart, we need to now take a look at this second chart below.
The Winter/Spring Fractal
This chart perspective is over a three year period. The highlighted areas show the winter correction as well as the spring rallies of 2008 and 2009. Notice how similar the price patterns are.
In each previous year, price made it above the secondary highs but failed to move to new highs immediately. In 2008 it turned out to be the price peak before the crash. In 2009 it turned out to be a high point followed by a five week correction before the big rally of 2009 took off.
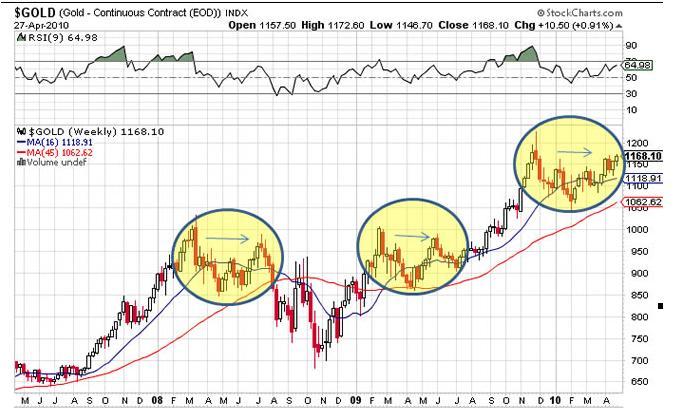
The price chart tells us that winter corrections have a tendency to last about 9 weeks and that a spring rally then develops. On average (but not always) the spring rally is where a price peak is likely to develop.
While price could continue higher here, and I think that will be the likely outcome, one should be on the lookout for any evidence that suggests a price high for this spring rally. So far there is none, but price is just arriving at the key price point for which we need to watch carefully. So what do we look for?
The first clue that a potential peak could be in place would be the failure of gold to exceed the 1185-1192 area followed by a pullback below the lows of the last week or the last two weeks. That would be a caution flag. As long as price remains above the lows we’ve established over the past few weeks – the 1125 -1135 area - the potential for a further move higher will still be in play.
In order to better understand just how important price is on the second chart above, let’s now take a look at the third chart which is below.
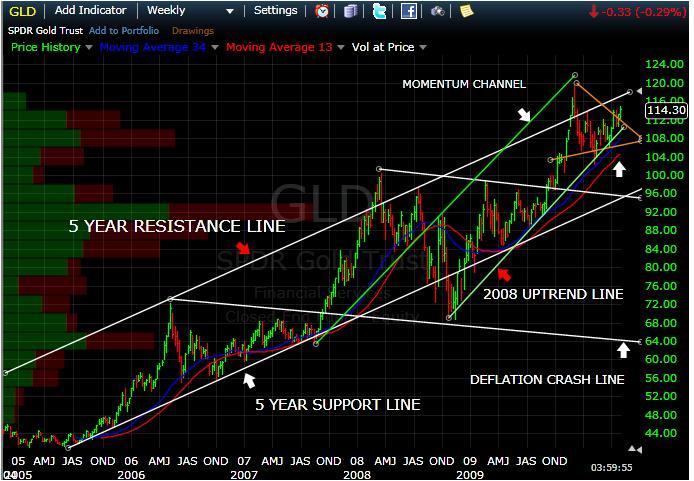
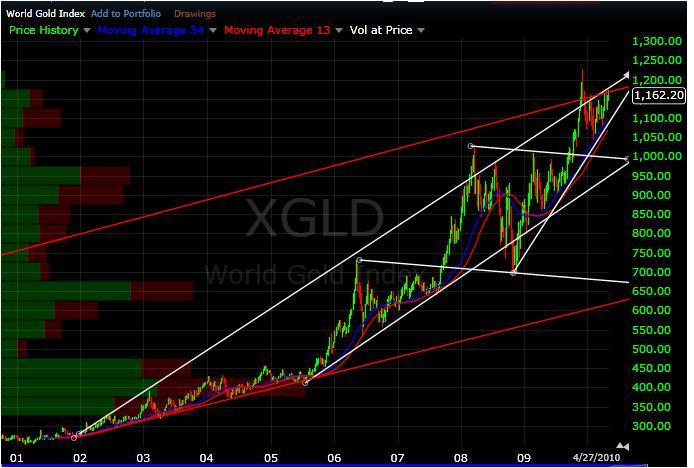
The third chart looks at a major portion of the 21st Century Gold Bull Market and it is an impressive sight. We can see from this chart that the white channel line we saw on the first chart earlier is actually a 5 year resistance line.
And we note there have only been four visits ever to this upper resistance line. This line represents the height of momentum of the entire bull market to date. It is a major resistance area. Our current bumping up against this line goes a long ways towards explaining why gold has been consolidating sideways for the past 5 months.
From this view we can see that gold is coiling up to make another attempt at this major resistance line as it did in 2008.
Compare the 2008 area on the chart with where we are today. Notice how uncanny the similarities are.
The probe above the channel line during 2006 produced a pullback and then a subsequent rally back to the white channel line. The current pattern is almost exact. It would only take one more push up to reach the line.
If we get a solid move above the white line, the upper green momentum channel line would become the next area of resistance. In this scenario, gold will literally go far higher than 1200.
What does this longer term timeframe of this chart tell us?
Well, it tells us that from past price action we find ourselves in an area now that has usually begun a good sized correction. Not that it will happen this time, or that it must happen. But this has been true in the past.
We can see the effect of the white upper resistance line in 2006, 2008 and now in 2010. This resistance line has not ended the bull market but it has certainly inspired corrective setbacks in price.
Could it be different this time? Were the circumstances at the previous peaks different from today?
Debt correlation
The first time gold reached this resistance area was in 2008 on the day that Lehman Brothers went bankrupt. And, we know that a subsequent market crash took place four months later.
The next time we hit the white line was in December 2009. That high in gold was only ONE WEEK after the Dubai debt announcement. That incident sent gold into a four month consolidation period. And now we have had a subsequent rally back up that has brought up back up to the white channel line.
I couldn’t help but observe that this time the bankruptcy headlines are the sovereign nations of Europe. Once again gold is in the same position as the previous times when a debt crisis flared up. It would seem the stakes are growing. The question we would ask is should we expect the same reaction from gold as in the past (i.e. gold corrects lower)? Or should we expect gold to escalate higher?
Let’s look at one more chart.
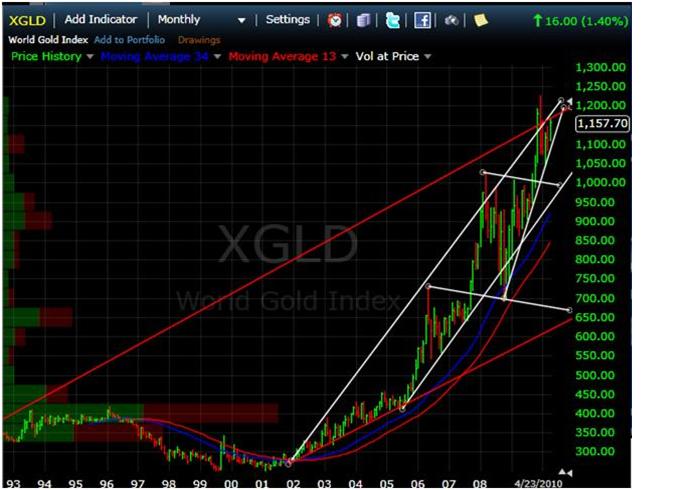
The long term chart of gold below shows that price has arrived at the final resistance area of the 21st Century Gold Bull Market. The white and red upper channel lines represent resistance areas that, if exceeded, could very well provide the exact spot where gold will accelerate much higher. Likewise, if this resistance area is not exceeded, this would represent the final technical stopping point for gold’s advance.
Notice how gold is coiled to the very brim of the upper most longest and oldest channel lines of the entire bull market. There is no other place for price to go. It must make a trend decision soon. That decision will likely determine whether price will continue to escalate at an even faster rate than we have seen in the past 10 years or whether gold is about to take a breather.
The red major resistance line is a 17 year old trend line drawn off the 1993 price high at 400 dollars per ounce. We can see how this red trend line is meeting up with the upper white channel line we observed on the earlier charts at the exact same time that price is reaching the potential zenith of this move.
There is a lower white line under price in this chart that is drawn off of the 2008 deflation crash low. This second white line has now reached and is touching the upper 17 year trend line. In between both of these two white lines lodged up into this upper boundary is PRICE.
From this view we can now see just how important our current price zone is and why gold has been consolidating for the past 4 or 5 months.
Here is another view on the weekly chart below.
Summary:
Gold has arrived at what is most likely its most important turning point of not only this year, but perhaps of its entire bull market. We can see now just how important the 1175-1225 area is for gold bullion. We can infer that gold is at the greatest risk/reward price zone of the entire bull market. The resistance lines meeting our current price point (or just above it) is where every major price high for gold has appeared in the past 10 years.
Can gold go higher from here? Is it different this time?
Yes, it can go higher.
If gold does break out above this major resistance zone, the odds would increase the probability that a projection of 1600-2000, or even higher, could become a reality.
If the past is to repeat then gold is nearing a correction into the middle portion of this year. Admittedly, this is what usually occurs at this time of year.
But with the convergence of several short and long term support/resistance lines at today’s price point, I have a feeling gold may surprise us with a break from past history. We will know this to be the case by the same way we always know. And that is by observing the price action.
If gold explodes higher from here, a new momentum channel will be formed. The most likely scenario will be the green channel lines labeled Momentum on the third chart would become new resistance.
And, should gold close below the lower white trend line on the final chart, then the potential for gold to reach the 980-1000 area this year will gain credibility.
The only thing that has affected gold in this bull market was the debt crisis of 2008. Since we are having the first throws of the sovereign debt crisis now, it would be prudent to keep a close eye on gold at this most important area.
Price lows for the year usually occur in the July/August time period. Not always, but more so than not. The metals have risen since February 5th. The potential for a price peak near our current price level cannot be discounted.
But until price stops going higher, we will respect this rally. If we falter near here we will respect historical precedence and look for a pullback into summer by calling an end to this spring rally.
We are now at a critical juncture in gold’s bull market. At www.GoldTrends.net we monitor the price pattern on an hourly, daily, weekly and monthly chart basis. And we offer extensive commentary on what it all means, along with support and resistance levels in advance of each day’s trade. If you would like to join us for the month of May and follow along with a free pass, send us an email.
We’d like for you to join us.
May you all prosper,
Bill
Bill Downey is an independent investor/ trader who has been involved with the study of the Gold and Silver markets since the mid 1980’s. He writes articles for public distribution for other newsletters and websites as well as his own free site at: http://www.goldtrends.net/Email: Goldtrends@gmail.com
© Copyright Bill Downey 2010
Disclaimer - The opinion expressed in this report is the opinion of the author. The information provided was researched carefully, but we cannot guarantee its total accuracy. The report is published for general information and does not address or have purpose or regard to advise specific investments to anyone in the general public. It does not recommend any specific investment advice to anyone.
© 2005-2022 http://www.MarketOracle.co.uk - The Market Oracle is a FREE Daily Financial Markets Analysis & Forecasting online publication.