Stock Market Catastrophic Down Wave, Coming Economic Calamity Could Lead to a New World Order
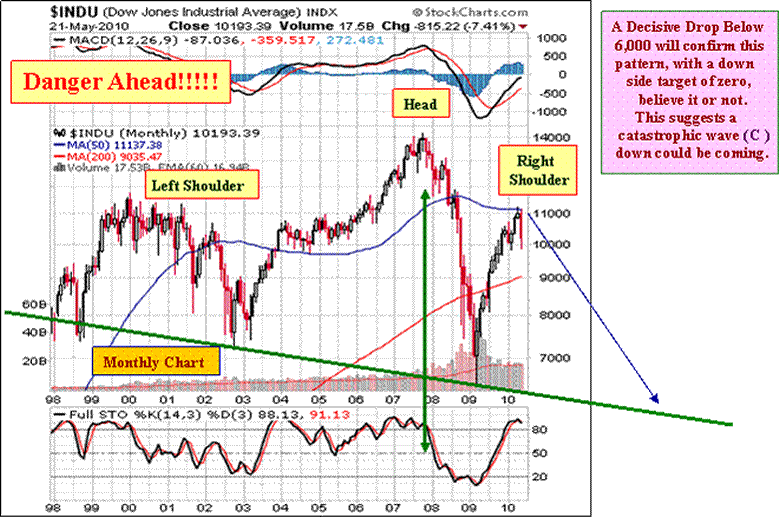
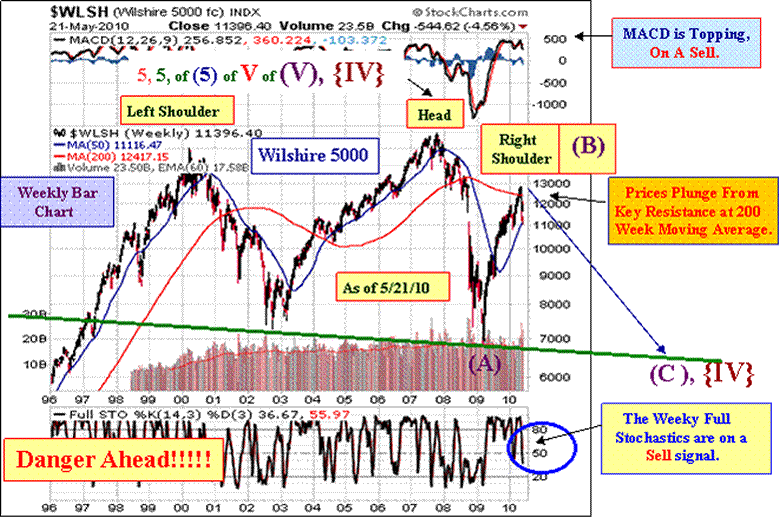
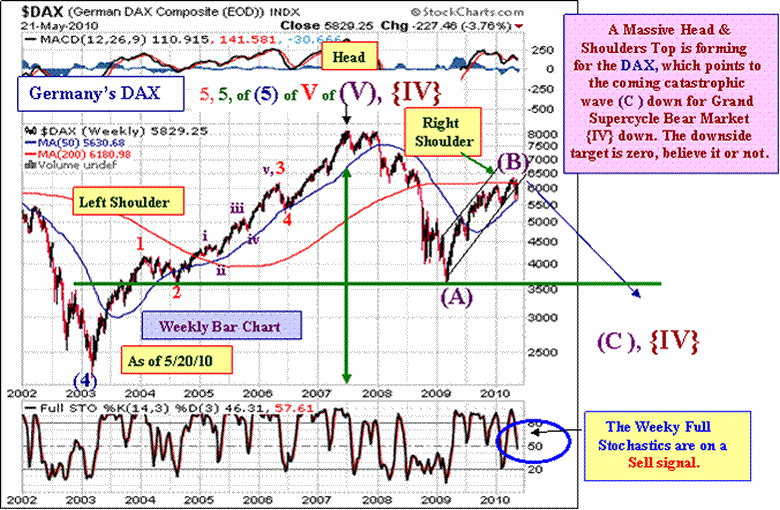
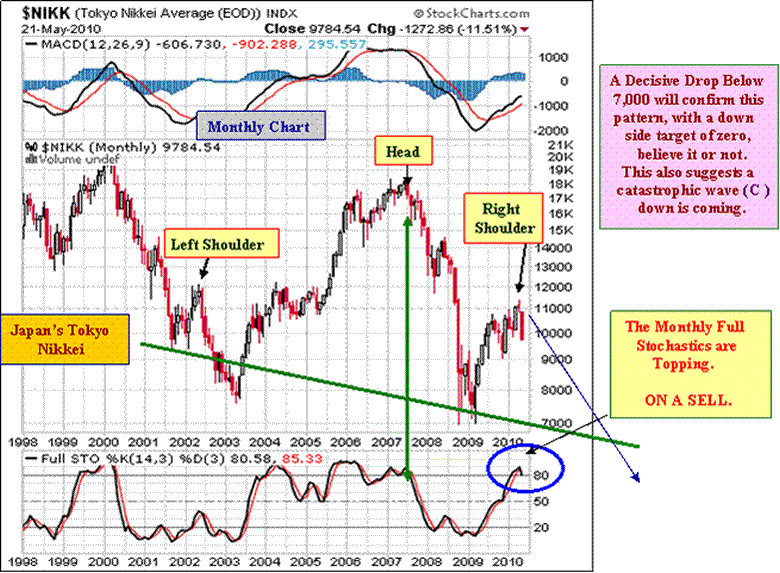
Stock-Markets / Stocks Bear Market May 23, 2010 - 07:35 AM GMT Big picture: We believe stocks have entered catastrophic wave (C ) down, which should be the third and most devastating phase of the Grand Supercycle degree wave {IV} Bear Market. This decline has the potential to be a nation changing economic meltdown. We have been showing for months several dangerous massive Head & Shoulders top patterns in major stock indices around the world.
The patterns were not complete when we first identified them, but they are now progressing rapidly toward completion and confirmation. Once prices drop below their necklines, which will be catastrophic enough, it means downside targets toward zero will be a high probability, which forecasts a complete global meltdown. We are not trying to scare you, but rather prepare you as to what the technical analysis charts are suggesting. Wish it was better news, but it is not.
So what does this mean? Permit us to give some educated speculative possibilities: It likely means there will be a political reaction to this meltdown like nothing we have ever seen before. You see how aggressive the Central Planners have been, closing the barn door after the horse has gotten out, spending at least $2 trillion that we know about, but are not sure where the money went. Well, multiply this by a thousand. We could see a reaction to a global economic meltdown that includes the following: Either by edict or by popular consent after a successful propaganda campaign, we could see the joining of a western economic intercontinental new sovereign nation, where European nations and North American nations join together, submitting their own sovereignties to a new nation where former nations become essentially states within that new western alliance nation. It would be sold as a necessary union to turn around a collapsed economic system and save the world. This western nation would have its own new currency, replacing the Euro, the Pound, the U.S. and the Canadian Dollars with something else.
There would be massive new controls put in place requiring people of all these nations to follow new rules and adopt new technologies if they want to buy or sell anything. Privacy would be completely lost, replaced by rigid accountability and mandates on the people. The U.S. Constitution would be replaced by something else, a Western Alliance Constitution that all European and North American nations would adopt and submit to. In other words, the fulfillment of the wishes and desires of the Bilderberg Group, of the Council on Foreign Relations, of NAFTA, of the Trilateral Commission. In effect, the coming of a New World Order which is already being worked on behind the scenes by Central Planners. That, I believe is where we will find ourselves at the end of this catastrophic third leg of the Bear Market. Make no mistake, I personally do not want this to happen, but I do believe it is where we are headed nonetheless. To learn more about this, you can read Daniel Estulin’s fascinating book, The True Story of the Bilderberg Group, the North American Union edition, available at amazon.com .
How soon? Hard to say, but the best guess here is sometime between 2012 and 2016. Between now and then we should see things get progressively worse, in stairstep fashion. The Central Planners have blown a one-time opportunity they had to prevent a collapse by doing a massive tax rebate to all U.S. Households. They have wasted so much money, which has disintegrated into thin air, that a massive tax rebate would blow up the Federal Deficit to the point where Greece’s sovereign debt problem would look like child’s play. I guess what I am suggesting, is that the technical charts and patterns are warning that a complete economic collapse is approaching the point of inevitability.
I am fascinated by the timing suggested by the big picture charts. If you extend trendlines down from the top of the right shoulders of charts we show on pages 12 through 19, symmetrical with the left shoulder, you see markets fully collapse from 2012 through 2016ish. Amazingly, if you go to the History Channel’s website, you can order a ton of productions pointing out a myriad of scientific and prophetic sources from many different and independent origins suggesting major upheaval during this same period of time. Then, if you go into the Biblical scriptures, including the Old Testament prophecies, we find the possibility of economic and world calamity arriving at a time in the not too distant future as well.
It is hard to tell if the Central Planners were incompetent in placing us in this position, or whether it is by design so a New World Order would come. The fact is, this is the threat we now face, and absent divine intervention, there is probably no way out.
What does one do? Well, Gold will be a good defensive holding. Cash could be important. Prayer would be the best defense. There is hope given in Biblical scriptures that although a time period such as this will come, it comes just before Messiah arrives and cleans up the mess our world finds itself in. Jesus spoke of this coming time in Matthew chapters 24 and 25, as well as in the book of Revelation. The Old Testament prophet Daniel spoke of these coming times as well. For hope regarding this coming time period, I can recommend the book, Rapture Redux, by Daniel J. Gansle, if you are interested. Also helpful in understanding what may be coming is Joel C. Rosenberg’s book, Epicenter. Both books are available at amazon.com . You can also click on the Hope button at our home page at www.technicalindicatorindex.com
Stocks may be Crashing. We define a crash as a decline of 15 percent or more. Since the April 26th, 2010 high of 11,258.01, the Industrials collapsed 1,388 points, or 12.3 percent. And we do not believe this decline is complete. Could there be a bounce somewhere in here? Sure, but lower lows are coming. In fact, Thursday’s decline generated lower closing lows, even below the Flash Crash closing lows on May 6th, or the closing lows of May 7th. This is deteriorating action, not bottoming action. Warning: stocks are very likely in catastrophic wave (C ) down. This is a very dangerous market. Thursday’s internals were some of the worst ever.
The S&P 500 fell 163.9 points, or 13.4 percent since their April 26th top. This is very close to a crash. The NASDAQ 100 is down a huge 307.1 points, or 14.9 percent. Financials are down 17 percent. Materials are down 16 percent. Energy stocks are down 15 percent. These segments are crashing. The S&P hit new lows for he decline from April 26th this week, on Friday, May 21st.
If you missed the February to April 2010 rally, you should be very happy this weekend. We played it conservative, not going long during that rally because the charts and indicators we follow were warning in neon lights that a major decline was in our near future. We did not believe it was worth the risk to chase a phony, fake-out rally, and get burned by the mainstream financial press’ and Central Planner propaganda that all was well with the world. All is not well with the world.
For the year 2010, The Industrials are down 2.25 percent. The S&P 500 is down 2.44 percent. The NDX is down 2.02 percent. The NASDAQ Composite is down 1.77 percent, Australia’s SPASX200 is down 11.6 percent for the year.
Thursday was the largest single day decline in the Industrials since March 2009, and the largest in the S&P 500 since April 2009.


Check out our May Specials, good through Sunday, May 23rd, 2010, including a fabulous 13 month offering, only $259, a little under $20 a month, or 2 years for only $459 at www.technicalindicatorindex.com . We added a 3 months for $89 budget friendly deal this week.
We also offer a FREE 30 Day Trial Subscription by clicking on the FREE Trial button at the upper right of our home page at www.technicalindicatorindex.com
“Jesus said to them, “I am the bread of life; he who comes to Me
shall not hunger, and he who believes in Me shall never thirst.
For I have come down from heaven,
For this is the will of My Father, that everyone who beholds
the Son and believes in Him, may have eternal life;
and I Myself will raise him up on the last day.”
John 6: 35, 38, 40
by Robert McHugh, Ph.D.
technicalindicatorindex.com
Robert McHugh Ph.D. is President and CEO of Main Line Investors, Inc., a registered investment advisor in the Commonwealth of Pennsylvania, and can be reached at www.technicalindicatorindex.com.
The statements, opinions, buy and sell signals, and analyses presented in this newsletter are provided as a general information and education service only. Opinions, estimates, buy and sell signals, and probabilities expressed herein constitute the judgment of the author as of the date indicated and are subject to change without notice. Nothing contained in this newsletter is intended to be, nor shall it be construed as, investment advice, nor is it to be relied upon in making any investment or other decision. Prior to making any investment decision, you are advised to consult with your broker, investment advisor or other appropriate tax or financial professional to determine the suitability of any investment. Neither Main Line Investors, Inc. nor Robert D. McHugh, Jr., Ph.D. Editor shall be responsible or have any liability for investment decisions based upon, or the results obtained from, the information provided. Copyright 2008, Main Line Investors, Inc. All Rights Reserved.
Robert McHugh, Ph.D Archive |
© 2005-2022 http://www.MarketOracle.co.uk - The Market Oracle is a FREE Daily Financial Markets Analysis & Forecasting online publication.


