S&P Stock Market Long Term Report Part 1
Stock-Markets / Stocks Bear Market May 31, 2010 - 06:10 AM GMTBy: Alistair_Gilbert
 With so much uncertainty in the world about Sovereign debt, alleged GDP growth figures from the U.S. (and others) and government issued inflation figures that are risible, the investor is left with a very confused picture as to whether we are in or entering a period of massive inflation or deflation. There are economists on both sides of the fence who are putting forward very plausible arguments to support both sides. This report will examine the technical picture of the S&P and guide you with the use of my charts as to where we are in the market and where it may be going in the future.
I am going to start off with the indicators on the big picture charts as I never see any other analyst posting annual or quarterly charts.
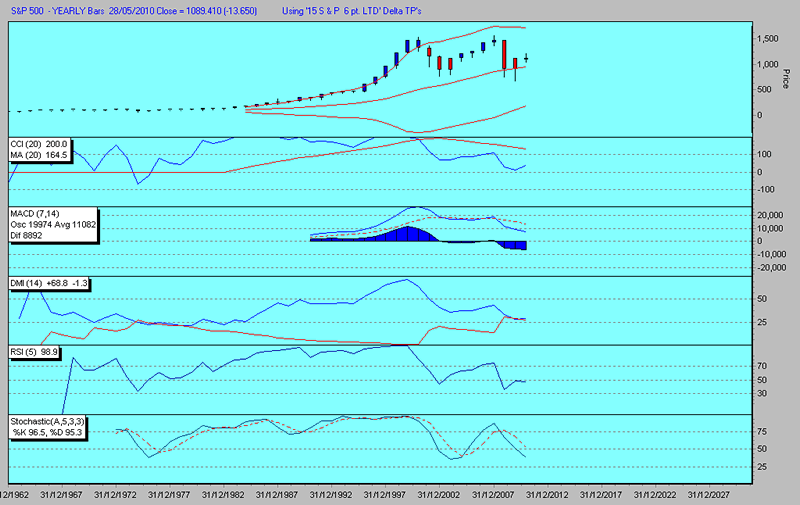
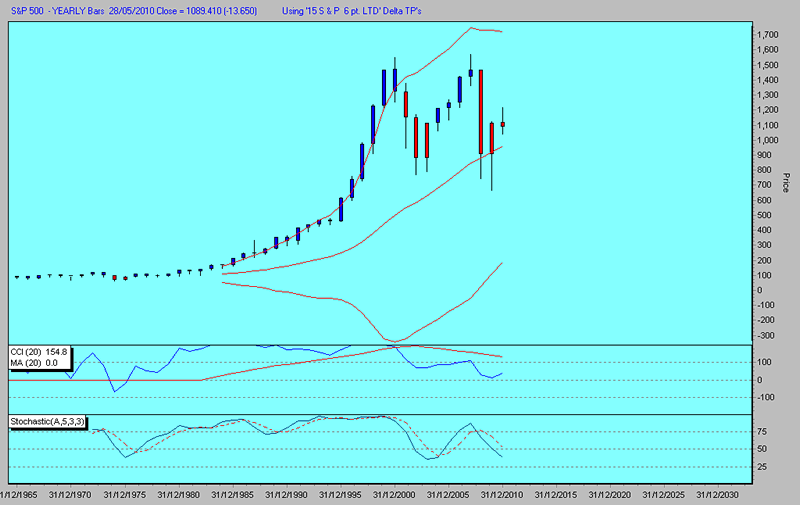
I must confess that I do not often look at the annual chart but it is VERY revealing. It shows that we are on the cusp of entering a generational slide in equities rather like the Japanese Nikkei did in 1989 when it peaked at 39000 and today, 21 years later only stands at 9700 having been as low as 6994. The chart of PRICE is very small on this next chart, but the important thing is to examine the indicators.
The annual CCI indicator topped in 2000 and issued a SELL signal as it crossed down through the moving average. It took 18 years for the moving average to climb from 0 to 200 and will probably take as long to return to 0. Note also the negative divergence when the S&P hit new highs in 2007, no new buy signals were given by the indicator moving above the Moving Average.

We have a similar picture with the MACD which also topped in 2000 and whilst it gave a minor SELL signal then, it only dropped a minor amount in 2002 but has dropped significantly since the 2007 highs. A fresh SELL signal was given in 2007 when the Oscillators crossed down but despite the S&P reaching new highs in 2007 the Histogram barely registered positive and has since dropped well below the 0 line.
We are seeing a negative picture with the DMI as well. It too peaked in 2000 and barely registered the rise of the S&P to new highs in 2007. It now sits on the point of crossing down to an all out SELL signal.
The RSI reached an amazing reading of 99.2 in the year 2000 and has fallen away since then with the indicator now reading 46.9 and heading down showing the strength ebbing from the market.
Finally, looking at the fast Stochastic, it too is showing negative divergence with the 2007 peak being much lower than the 2000 peak and is pointing to 2012 as the potential short-term low.
The one positive note that we have for the time being is the Bollinger Bands on the PRICE chart. Here they remain in the upper band as they have been since 1982 but the last two years have penetrated the middle band and it is only a matter of time before PRICE descends into the lower Bollinger Band on a more permanent basis.
Because of the size of this Report, I will issue Part 2 in a few days time, when we will look to the quarterly and monthly charts.

The ideas expressed in this Report are the thoughts of Alistair Gilbert and represent part of the intricate process that he goes through before arriving at a trading decision and as such are like a trading diary. Alistair Gilbert is not an authorised investment adviser and as such none of his statements should be construed as investment advice. The value of investments can go up as well as down and trading is very high risk. Readers are advised to consult with their own investment advisers who may be better qualified to offer a trading strategy based on your own individual circumstances.
By Alistair Gilbert
ALISTAIR GILBERT has worked in the markets for over 30 years. He has worked as an institutional research analyst for a firm of stockbrokers where he got his grounding as a technical analyst. He has also worked as branch manager of a firm of stockbrokers managing private client portfolios and as a fund manager for a leading merchant bank. Alistair was also Managing Director of a Swiss Fund Management group with over $1 billion under management and developed the business extensively in the Middle East.
Alistair has now returned to his native England where he now specialises in TIME and PRICE analysis utilising Elliott Wave, DELTA and a range of technical indicators. I can be contacted via alistair@alistairgilbert.com
Copyright 2010 Alistair Gilbert
Disclaimer: The ideas expressed in this Report are the thoughts of Alistair Gilbert and represent part of the intricate process that he goes through before arriving at a trading decision and as such are like a trading diary. Alistair Gilbert is not an authorised investment adviser and as such none of his statements should be construed as investment advice. The value of investments can go up as well as down and trading is very high risk. Readers are advised to consult with their own investment advisers who may be better qualified to offer a trading strategy based on your own individual circumstances.
Alistair Gilbert Archive |
© 2005-2022 http://www.MarketOracle.co.uk - The Market Oracle is a FREE Daily Financial Markets Analysis & Forecasting online publication.


