


SP-500, GLD and GDX Investor Sentiment Trumps Everything
Stock-Markets / Stock Market Sentiment Jul 25, 2010 - 12:42 PM GMTBy: John_Townsend

 Markets rise when the preponderance of participants are buyers, and fall when the preponderance of participants are sellers. One of the key ways to anticipate the pendulum swings of participant behavior, and therefore price behavior, is to evaluate sentiment. Sentiment, more than fundamentals or technical analysis, trumps everything.
When too many players are on the same side of a trade they eventually find themselves in a crowded position where most everyone around them has the same motivation – to reverse their position when the tide changes.
Little by little, as participants slip out the back door by changing the bias of their position, the pendulum of price swings more sharply against the remaining herd in the crowded trade. Inevitably, something akin to panic sets into the herd as they begin to aggressively reverse their position for financial survival. The primary ingredient that causes price to catapult, up or down, is sentiment oscillation and capitalization from one sentiment extreme to the other.
An astute market technician, investor or trader will look for those flash points where conditions are ripe for a market reversal. It sounds easy to do, but remember that when the analysis is very convincing, the preponderance of market participants will disagree. It seems that to be effective at market timing one needs to listen not to what others are saying, but to what the sentiment data represents as truth.
With these thoughts as a foreword, let’s see what the current sentiment situation is for the SP-500.
The following chart is from Market-Harmonics and assimilates 4 years of bull/bear percentage data from Investor’s Intelligence. To this chart I have measured and notated in blue the percent change in bearish advisors per the Investor’s Intelligence data, for each downswing of the SP-500. My notation in green is the percentage change in bearish advisors for the related upswing of the SP-500. The price of the SP-500 is notated in black at each swing peak and trough.
One of the most striking observations I have made of this data is that it appears the maximum pendulum swing in the bearish direction is a 20% change. This occurred in Q1, 2008. More frequently this percentage change has topped out at 19%, followed by 16%, 11% and smaller percentage changes.
The obvious conclusion I come to is that our current bearish % change situation, at a 19% reading, is about at the maximum. History seems to show that investor’s emotions, like a physical rubber band, can only be stretched so far into pessimism (19-20%) - the bearish direction - before they snap back in the opposite bullish direction.
The pendulum swing in the bullish direction is about to begin at this very time.
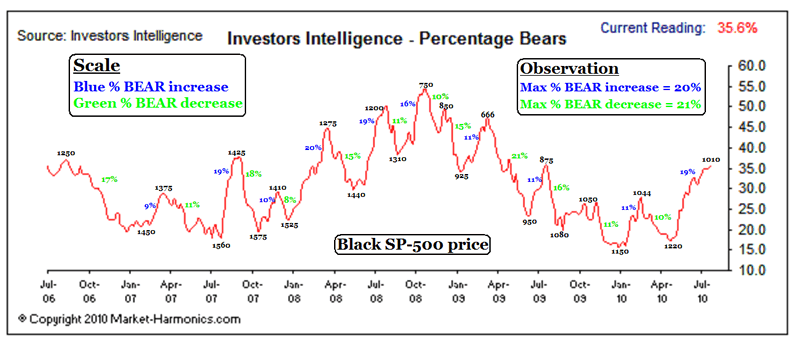
I would expect that the stock market could not possibly peak until the % of bears decrease by a minimum of 8%, and more statistically likely 10-15%. With a current reading of 36%, I am suggesting that we should not even consider a peak in the stock market until the bear percentage reading drops from where it is now at 36% to 28%, and more likely to around 26-21%.
What this means for now is that 1100 is not the top in the SP-500. Far from it. The bears have not even begun to turn into bulls. Price will go much higher from here and it will take weeks, if not a couple of months, minimum, to reach a shift where the % of bears are themselves finally out of whack on the teeter-totter.
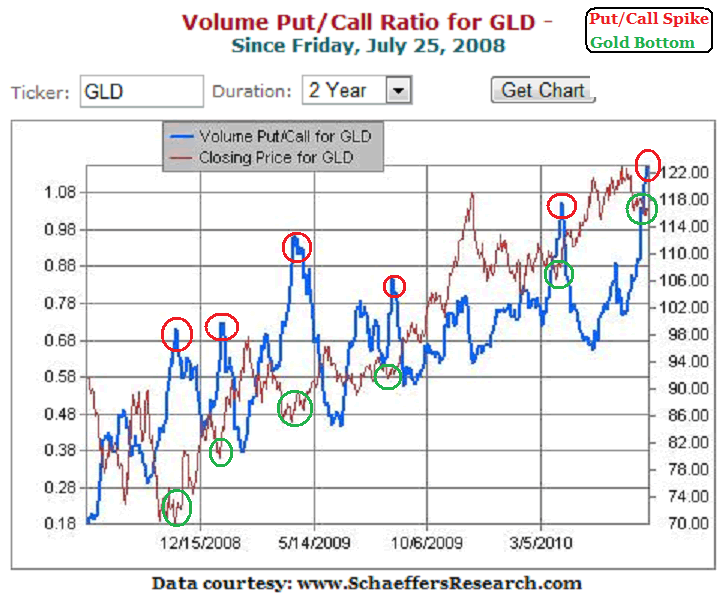
Gold, while not covered by Investor’s Intelligence to my knowledge, would appear to be in a similar setup as the stock market. For this I turn to data published this past week at Schaeffer’s Investment Research and look at the 2 year history of the GLD put/call option ratio.
When the put/call ratio spikes high, it means that traders/investors are convinced that the price of gold will fall. I have circled on the chart such instances from the past two years in red.
What we can observe is that when the bearish trade gets excessively crowded, when a preponderance of participants are convinced that gold will fall, that is not the top in gold. Rather, it is the bottom. I have circled with green the price of gold for each occasion of a put/call ratio spike.
Again, think about what is going on here. When the put/call ratio spikes upward you have an intense perception and emotionally dramatic conviction of traders that substantially puts too many folks on the same side of the trade. When gold starts to move against them, even just a little out of their expectation range, each owner of a put option is no longer a seller of gold, but becomes a motivated buyer of gold! This is precisely how huge brisk run ups in price are both setup and then executed.
If I were presently short gold and looked at this chart it would send shivers down my spine. No kidding. Nothing like finding out you are in a crowded trade that once it starts to go bad, you KNOW it will go very bad.
Now, I am not saying that the bottom for gold is in just yet. Gold could still delight the bears and frustrate the bulls with one last brief maneuver lower this week. But after that, if it happens, I believe gold’s low will most definitely be in and then there will be a lot of folks who will wish they did not hold puts on gold.
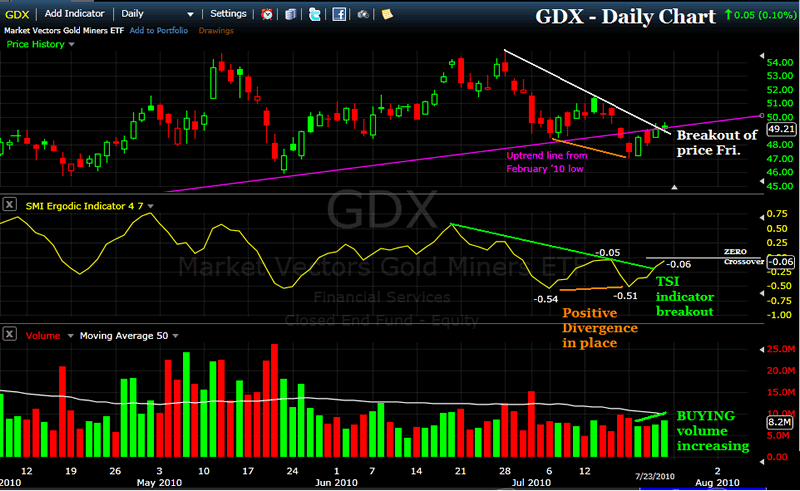
While gold has not yet told us if the last shoe has dropped, the GDX miner ETF, however, is suggesting a favorable outcome. The following daily chart is the GDX and below its price movement is the True Strength Index Indicator (TSI) with volume. You can make you own chart and use the TSI indicator by visiting FreeStockCharts.
On the negative side for GDX, the True Strength Index indicator reading is still barely below ZERO in negative territory (-0.06). On the positive side, GDX is sporting a positive divergence between price and the indicator, a recapture of the uptrend line begun last February, a breakout of a 4 week price downtrend line and a breakout of the TSI indicator on increasing positive volume. All in all, I regard this setup as bullish for GDX and most likely for GLD, as well.
If you enjoy technical analysis, maybe are curious to learn more about the True Strength Index indicator and how to use it, or just like to be a part of discussion about market and gold price direction, I invite you to visit my website. www.theTSItrader.blogspot.com I provide some useful data on 15 mining stocks with explosive projected earnings, a study of the gold secular bull market beginning in 2001 with charts, and heck, I even post my trading record. Or, you can drop me a line at: tsiTrader@gmail.com
Good trading to you,
John Townsend
mailto:TSItrader@gmail.com
© 2010 Copyright John Townsend - All Rights Reserved
Disclaimer: The above is a matter of opinion provided for general information purposes only and is not intended as investment advice. Information and analysis above are derived from sources and utilising methods believed to be reliable, but we cannot accept responsibility for any losses you may incur as a result of this analysis. Individuals should consult with their personal financial advisors.
© 2005-2022 http://www.MarketOracle.co.uk - The Market Oracle is a FREE Daily Financial Markets Analysis & Forecasting online publication.