


EWH, The Sexiest ETF Chart of the Week
Companies / Exchange Traded Funds Oct 23, 2010 - 12:18 PM GMTBy: Jared_Levy

 I spend most mornings trolling my wheelhouse of sites for charts that look interesting, giant cup of coffee in hand.
I tend to look over a large spread of different sectors, to really get a good lay of the land. This morning I found a chart that just can't be ignored... and what I liked about it even more than its technicals was where it's based.
Sure, this has been a good week for U.S. companies, with GOOG, NFLX, UPS and more all reporting blowout numbers and the inflate-a-rally continuing to drive multinational companies like PEP, KO and MCD to all-time highs. (Hopefully, you read my article and positioned yourself appropriately.)
Our guest editor, Kent Lucas, wrote this week about China and how it is vastly misunderstood. In his opinion, which I share, the bulk of Chinese investments are viewed as extremely risky. I believe it's unfair to make any blanket assumptions without looking deeper into the numbers. Of course, risk is relative in investing and any stock carries with it unique risks that you must understand.
So, in the spirit of reducing risk by diversification and looking for a way for you to invest in China, I found an exceptional ETF that has outperformed the incredibly popular FXI (China 25 index), the GXC (S&P China Index) and the FCHI (China HK listed) over the past year. In fact, this ETF is up more than 20% YTD, while the FXI is only up about 10%.
Why I Like This Fund
The MSCI Hong Kong Index Fund (EWH:NYSE) provides its investors with returns based on the performance of the MSCI Hong Kong Index, the index that accounts for about 85% of the total market cap in the Honk Kong equity market. Keep in mind that many of the companies listed in the MSCI are tradable here in the U.S., but most only on the "pink sheets," which can be illiquid and hard/expensive to trade.
Since the fund began in 1996, it has returned an average of about 5.4% to investors, but has really taken off as of late.
The index contains a blend of all types of companies with the bulk of them being financial firms (over 60% as of Sept. 30, 2010). The next largest holdings are in utilities (13%), consumer discretionary (12.5%) and industrials (11.4%).
If you believe in China's continued growth story like I do (and you should!) and are looking for an efficient, diversified vehicle to get you there, the EWH offers a relatively lost-cost, low-stock-price way to do it.
(Investing doesn't have to be complicated. Sign up for Smart Investing Daily and let me and my fellow editor Jared Levy simplify the market for you with our easy-to-understand articles.)
Longer-Term Technicals
I wanted to take a step back for a second and look at the weekly chart of the EWH, because I believe the story here could be longer than a week or two.
From the late 2008 high of $24.29 to the low of $8.36 (that is the widest, most recent range), you can see the Fibonacci retracement line. I think this recent rally is sustainable with a minor retracement moving the ETF down to the $18.40 price level, which is 61.8% of the move that I indicated. There is much stronger support down at $16.40, which can be your absolute stop level if $16.40 is violated with bearish momentum.
There is upside resistance at around $20 and again at $21 and then the high at $24, so if you are in the stock and approaching those levels, you can sell an at-the-money covered call to hedge yourself against "stickiness" at those levels or a pullback.
EWH Weekly Chart
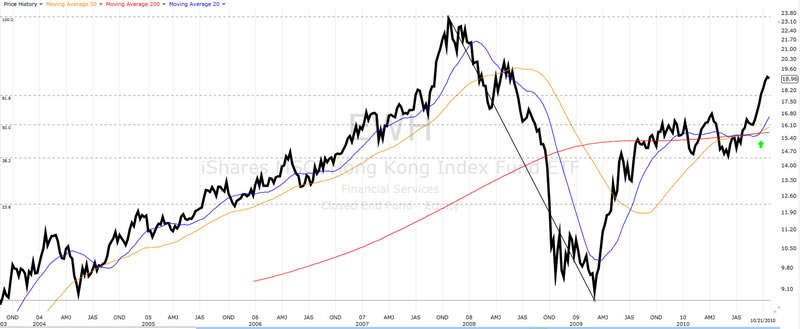
Source: Freestockcharts.com
In the Short Term
From a daily chart perspective (below chart), I feel the index has had a tremendous run, but has stayed within the confines of its "normal" trading patterns. It is most likely that the index will see a small pullback, like what we saw yesterday, and provide us with an entry right around the 20-day moving average, which is right around the $18.60 level, 20 cents above the Fib retracement level I was looking at. I think that area looks to be the preferred entry point.
If you are long, monitor the 50-day moving average for support. You can maintain the position as long as EWH maintains that level and the $16.40 level I discussed earlier; if it breaches either, that may be time to exit as it could be a change in trend. Trading breakouts can be risky, but very profitable at the same time. EWH did break out of its prior trading range in mid-September, but in my opinion, this sideways "channeling" should be the pause the index needs for the next leg up.
EWH Daily Chart
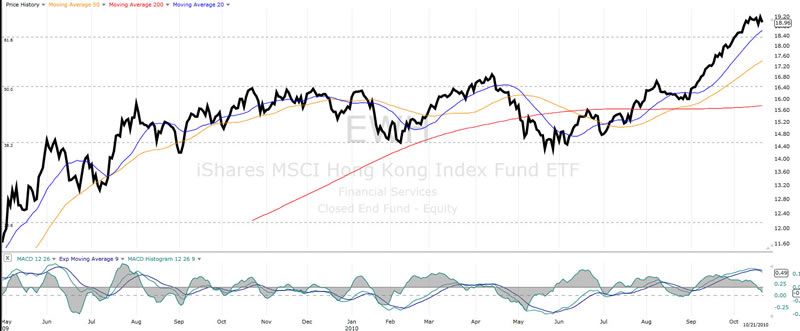
Source: Freestockcharts.com
Summary
The bottom line is that the EWH can provide an excellent diversified vehicle if you want to put some money to work in China with exposure to many different hot sectors like finance, the evolving (and spending) consumer and industry.
The breakout chart that we see above is an indication of its recent and hopefully continued strength as long as those simple technical rules are followed. EWH is a great long-term buy.
P.S. I'd certainly classify myself as a "chart guy"... but my colleague Adam Lass is a bona-fide chart guru. He developed a proprietary charting system that just celebrated its 10th anniversary -- and in those 10 years has pumped out mind-boggling gains like 787%... 403%... 507%... 493%... and many, many more! If you're a "chart guy" -- or looking to become one -- check Adam out.
Don't forget to follow us on Facebook and Twitter for the latest in financial market news, investment commentary and exclusive special promotions.
Source : http://www.taipanpublishinggroup.com/...
By Jared Levy
http://www.taipanpublishinggroup.com/
Jared Levy is Co-Editor of Smart Investing Daily, a free e-letter dedicated to guiding investors through the world of finance in order to make smart investing decisions. His passion is teaching the public how to successfully trade and invest while keeping risk low.
Jared has spent the past 15 years of his career in the finance and options industry, working as a retail money manager, a floor specialist for Fortune 1000 companies, and most recently a senior derivatives strategist. He was one of the Philadelphia Stock Exchange's youngest-ever members to become a market maker on three major U.S. exchanges.
He has been featured in several industry publications and won an Emmy for his daily video "Trader Cast." Jared serves as a CNBC Fast Money contributor and has appeared on Bloomberg, Fox Business, CNN Radio, Wall Street Journal radio and is regularly quoted by Reuters, The Wall Street Journal and Yahoo! Finance, among other publications.
Copyright © 2010, Taipan Publishing Group
© 2005-2022 http://www.MarketOracle.co.uk - The Market Oracle is a FREE Daily Financial Markets Analysis & Forecasting online publication.