


U.S. Dollar USD Index Trend Forecast Update
Currencies / US Dollar Oct 27, 2010 - 07:50 AM GMTBy: David_Petch

 The present action of the USD is congruent with the various forms of quantitative easing at the moment. All forms of paper currency are becoming weakened as all larger governments expand their fiat. If China and the US goverments add alot of paper, it can be converted into other currencies or assets. IF the funds are converted to say Canadian dollars, the Canadian currency was just indirectly debased. This is due to global conversion from one currency to another. Any country that produces anything in the coming years is going to see strength in their local currency, which in turn will increase with demand.
Debasing currencies on the whole will see rising prices. So, while there is likely to be sharp decline in broad stock indices somewhere between March 2011 until August 2011, the general trend till mid 2012 appears to be up. I should stress that 2013 and 2014 are likely to be very bad years, givein 2008-2012 appear to be not that bad...this falls in line with the US Presidential cycle having the first two years as being the worst. So, at present, markets appear to be congruent with the actions of US dollar that is being debased...the only thing not congruent with the USD are politicians stating they want a strong dollar.
Currencies
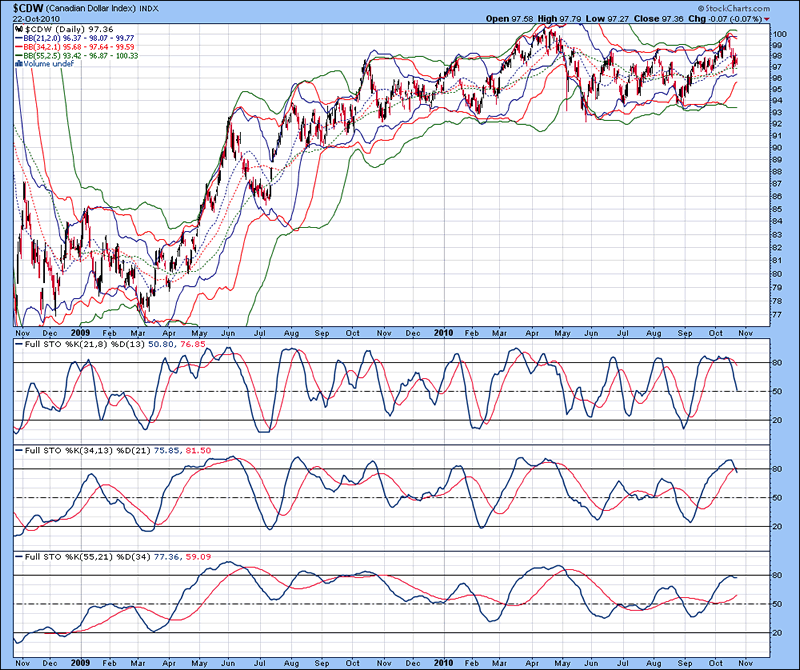
The daily chart of the Canadian dollar index is shown below, with upper Bollinger bands above the index, suggestive a top was put in place. Lower 21 and 34 MA Bollinger bands are in close proximity to the index, suggestive that further downside exists. Full stochastics 1, 2 and 3 are shown below in order of descent, with the %K beneath the %D beneath the %D in 1 and 2 and above the %D in 3. There is always the chance the Canadian dollar could reverse and go sideways again, but chances are the downside continues for another 2-3 weeks before any sort of low is put in place.
Figure 1
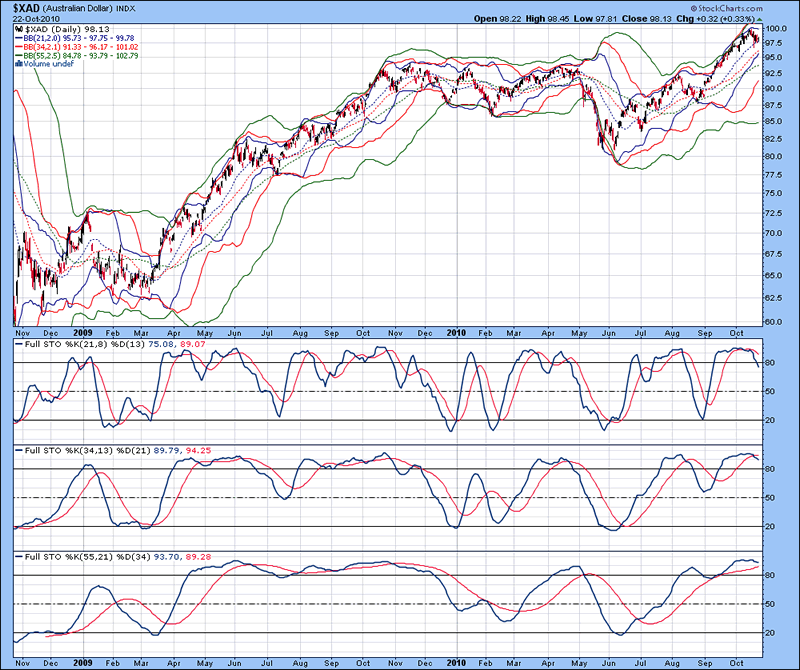
The daily chart of the Australian dollar index is shown below, with upper Bollinger bands riding above the index, suggestive that a top was put in place. Lower 21 and 34 NA Bollinger bands are rising to meet the index, while the lower 55 MA BB is just starting to curl up..when this happens a top will be confirmed. Full stochastics 1, 2 and 3 are shown below in order of descent, with the %K beneath the %D in 1 and 2 and above the %D in 3... notice how the %K in stochastic 3 curled down. There is the potential for downward prices action lasting 3-4 weeks at a minimum.
Figure 2
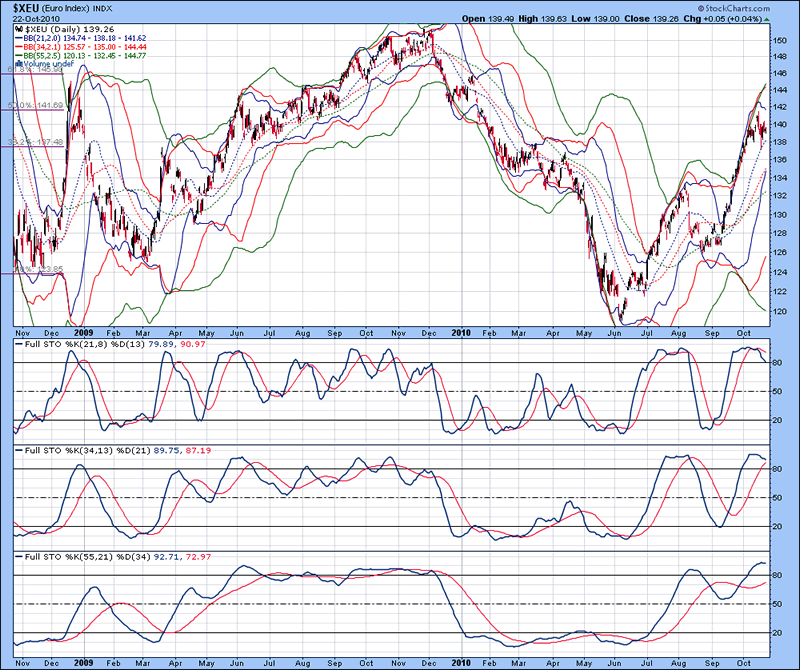
The daily chart of the Euro index is shown below, with upper 34 and 55 MA Bollinger bands still rising above the index, suggestive that a top was put in place. The lower 55 MA Bollinger bands has not curled up yet to confirm that at top was put in place, so it is possible that the Euro takes another 3-5 days of topping before declining. Full stochastics 1, 2 and 3 are shown below in order of descent, with the %K beneath the %D in 1 and above the %D in 2 and 3. Notice how the %K in stochastic 2 curled down, indicating that a downward trend is likely to ensue within the next week.
Figure 3
US Dollar Index
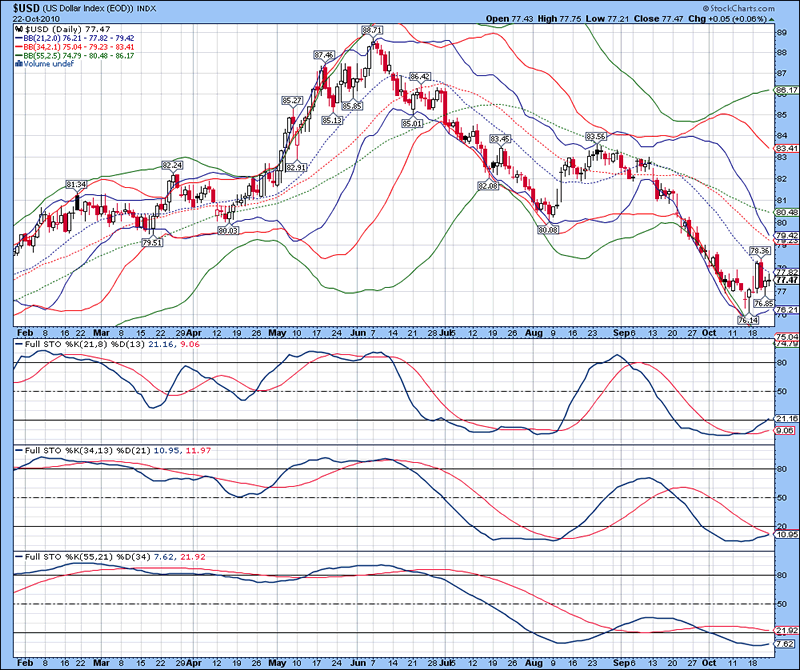
The daily chart of the USD index is shown below, with lower Bollinger bands well beneath the index, suggestive that a bottom was recently put in place. The upper 55 M A Bollinger band has not yet curled down to confirm that a bottom was put in place. Full stochastics 1, 2 and 3 are shown below in order of descent, with the %K above the %D in 1 and beneath the %D in 2 and 3. The daily chart is neutral to mildly bullish. The USD should remain in a sideways to upward trend for most of November before another leg down occurs.
Figure 4
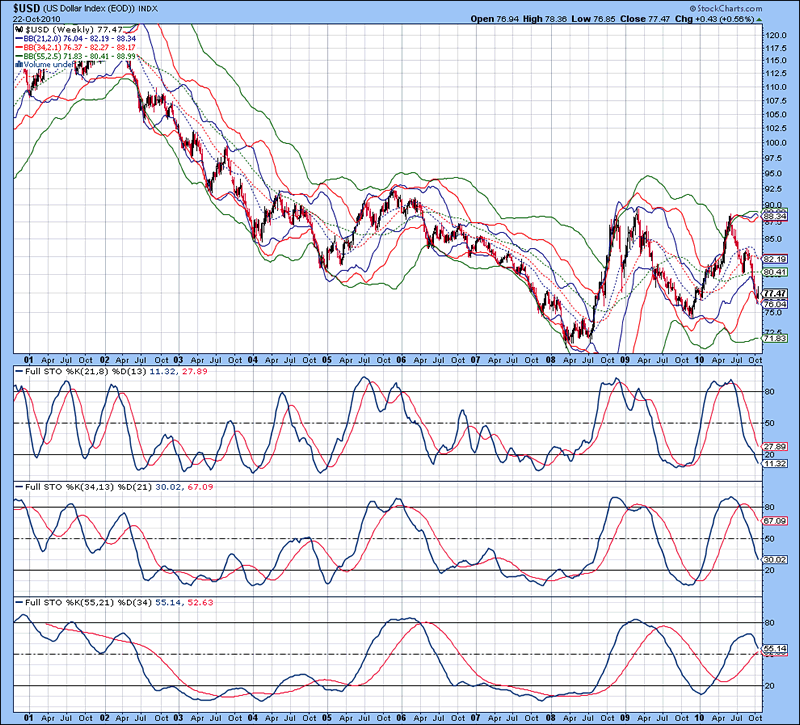
The weekly chart of the USD is shown below, with upper Bollinger bands above the index, failing to fan out, suggesting that a mid-term bottom is not probable for at least 2-3 months out. Full stochastics 1, 2 and 3 are shown below in order of descent, with the %K beneath the %D in 1 and 2 and above the %D in 3. Extrapolation of the %K in stochastics 1 and 2 suggest 3-4 months before a bottom is put in place. Expect a 2-4 week bounce in the USD coming up before a resumption in the downtrend to test the 72-73 area, not expected to complete until February/March 2011.
Figure 5
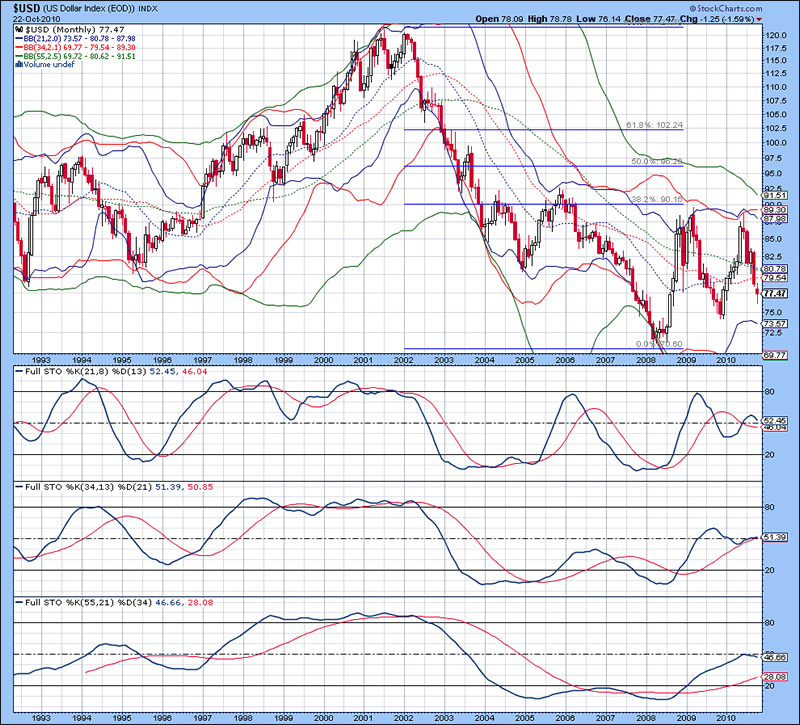
The monthly chart of the USD index is shown below, with upper Bollinger bands still well above the index. Full stochastics 1, 2 and 3 are shown below in order of descent, with the %K beneath the %D in 1 and above the %D in 2 and 3. Positioning of the %K in stochastic 3 suggests a rise is due after a bottom is put in place sometime in Februaryish, 2011, which should last for 5-7 months before topping out (June/July 2011) and decline into early 2012. During the latter half of 2011, the stock markets, gold and silver (especially bullion and their related stocks) etc. should do very well into early 2012. The USD is likely to bottom in the 63-65 area, before having a strong rally into late 2012...this period of time will likely see weakness in gold bullion with a rising USD. Once people wake up on December 22nd 2012 and realize that the sun is still rising and the birds are still chirping, there will be a very strong rally into March/April 2013 before stocks suffer a very strong leg down due to economic weakness and energy shocks of peak oil causing the economy to contract to a level where oil prices are again reasonable. Economic cycles are going to be based more on energy availability in the coming years than demographics etc. so consider this tidbit of information.
Figure 6
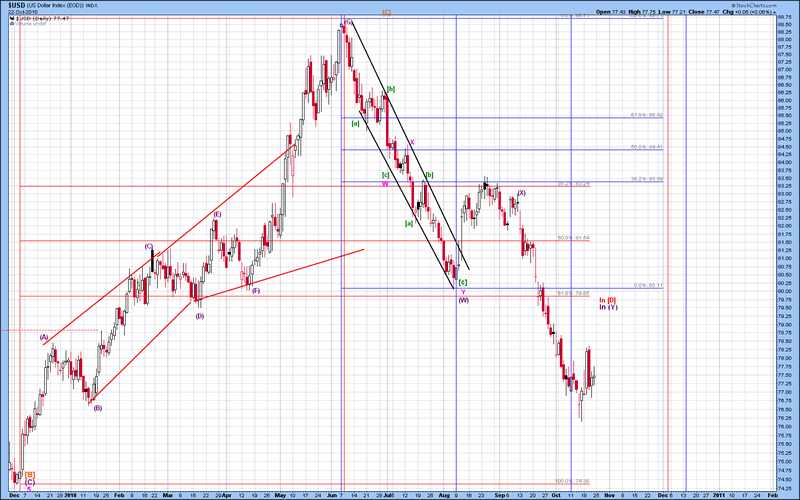
The short-term Elliott Wave count of the USD index is shown below, with wave (Y).[D] thought to be forming. Figure 8 shows a more comprehensive picture of the Elliott Wave count.
Figure 7
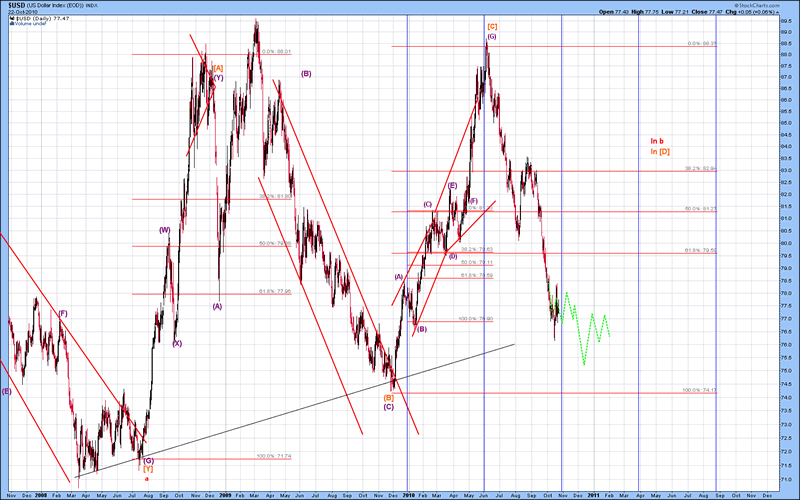
The mid-term Elliott Wave count of the USD index is shown below, with the thought pattern forming shown in green. Expect 3-4 weeks of mild sideways to upward price action, followed by a move down to test the 72-74 area...the dip could go well below the shown green pattern, but should follow somewhat of a similar pattern. Wave [D] is currently underway, with wave [E] of a triangle thought to be the next leg up, lasting into the July/August 2011 time frame before declining through the 2008 levels. Based upon analysis of the USD, it serves as road map for how to proceed with investments in different sectors over the coming 12-18 months.
Figure 8
Have a great day.
By David Petch
http://www.treasurechests.info
I generally try to write at least one editorial per week, although typically not as long as this one. At www.treasurechests.info , once per week (with updates if required), I track the Amex Gold BUGS Index, AMEX Oil Index, US Dollar Index, 10 Year US Treasury Index and the S&P 500 Index using various forms of technical analysis, including Elliott Wave. Captain Hook the site proprietor writes 2-3 articles per week on the “big picture” by tying in recent market action with numerous index ratios, money supply, COT positions etc. We also cover some 60 plus stocks in the precious metals, energy and base metals categories (with a focus on stocks around our provinces).
With the above being just one example of how we go about identifying value for investors, if this is the kind of analysis you are looking for we invite you to visit our site and discover more about how our service can further aid in achieving your financial goals. In this regard, whether it's top down macro-analysis designed to assist in opinion shaping and investment policy, or analysis on specific opportunities in the precious metals and energy sectors believed to possess exceptional value, like mindedly at Treasure Chests we in turn strive to provide the best value possible. So again, pay us a visit and discover why a small investment on your part could pay you handsome rewards in the not too distant future.
And of course if you have any questions, comments, or criticisms regarding the above, please feel free to drop us a line . We very much enjoy hearing from you on these items.
Disclaimer: The above is a matter of opinion and is not intended as investment advice. Information and analysis above are derived from sources and utilizing methods believed reliable, but we cannot accept responsibility for any trading losses you may incur as a result of this analysis. Comments within the text should not be construed as specific recommendations to buy or sell securities. Individuals should consult with their broker and personal financial advisors before engaging in any trading activities as we are not registered brokers or advisors. Certain statements included herein may constitute "forward-looking statements" with the meaning of certain securities legislative measures. Such forward-looking statements involve known and unknown risks, uncertainties and other factors that may cause the actual results, performance or achievements of the above mentioned companies, and / or industry results, to be materially different from any future results, performance or achievements expressed or implied by such forward-looking statements. Do your own due diligence.
Copyright © 2009 treasurechests.info Inc. All rights reserved.
Unless otherwise indicated, all materials on these pages are copyrighted by treasurechests.info Inc. No part of these pages, either text or image may be used for any purpose other than personal use. Therefore, reproduction, modification, storage in a retrieval system or retransmission, in any form or by any means, electronic, mechanical or otherwise, for reasons other than personal use, is strictly prohibited without prior written permission.
David Petch Archive |
© 2005-2022 http://www.MarketOracle.co.uk - The Market Oracle is a FREE Daily Financial Markets Analysis & Forecasting online publication.