How Long Can the S&P 500, Precious Metals, & Bonds Rally?
Stock-Markets / Financial Markets 2011 Jan 05, 2011 - 08:35 AM GMTBy: J_W_Jones
 In the fine print of most investment advertisements or in the softly spoken disclaimer at the end of a commercial, we generally read or hear the phrase “past results are not indicative of future performance”. While those exact words may not be written or uttered, something along those lines is found on almost any piece of investment literature or in investment product commercials.
In the 2nd half of 2009 all the way through 2010 a variety of asset classes performed quite well.
Investors who purchased stocks, gold or silver, and bonds anytime in 2009 were handsomely rewarded in 2010 if they held their positions. How long will these assets continue to perform well? How long can gold pump out double digit returns before suffering a bad year? How high can stocks climb when uncertainty seemingly surrounds the marketplace? Price action is never wrong, but history reminds us that a particular asset class does not outperform all other asset classes consistently over long periods of time. Trees do not grow to the sky.
Since 2009 stocks, precious metals, and bonds have all had tremendous performance records. Most economists point to actions by the Federal Reserve as the primary reason because these interventions lowered interest rates to extremely low levels which caused investors to take more risk for better returns. High levels of liquidity paired with low interest rates moved nearly every asset class higher, with stocks and precious metals earning outstanding year over year returns.
With 2011 just starting, will stocks, bonds, and precious metals continue rallying? When looking at probabilities and statistics the odds are not favorable that all 3 asset classes will remain outstanding investments. In fact, it is possible and arguably likely that at least one of the asset classes if not more than one will face headwinds in 2011 and beyond. While Tuesday was only the second day of 2011, precious metals are under significant pressure and the fundamental picture for bonds and stocks is uncertain.
S&P 500
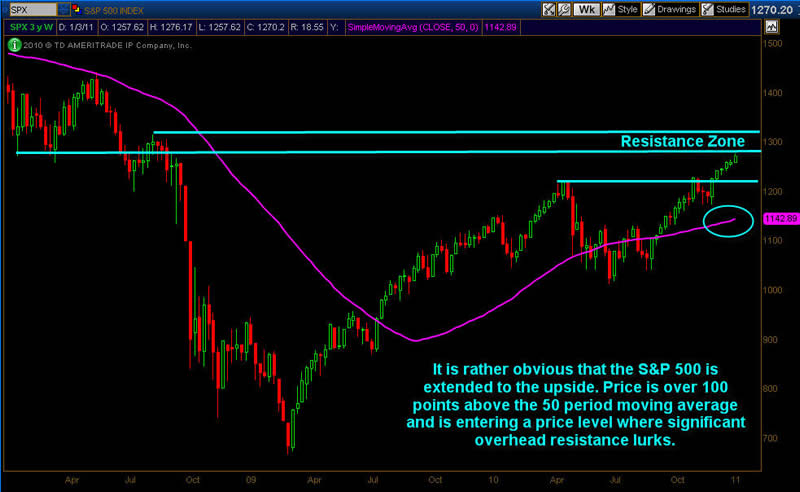
Stocks are overbought currently on nearly every time frame. Some pundits are calling for another outstanding year while others believe a correction is likely to unfold. I for one am totally unsure about the future, but what I am certain of is that I would be cautious at this current juncture in time. I would not be afraid to take profits and adjust stops to protect my trading and investment capital at these levels. Risk seems excruciatingly high and when we look at a longer term chart of the S&P 500 it is rather easy to surmise that a pullback may take place.
Precious Metals
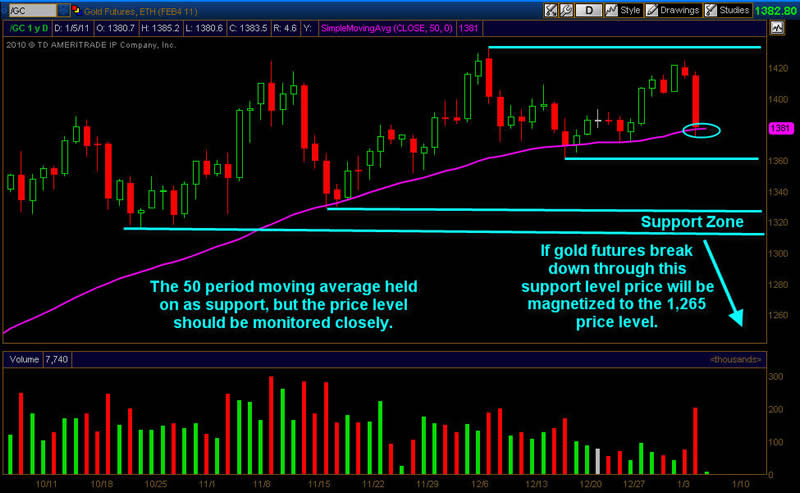
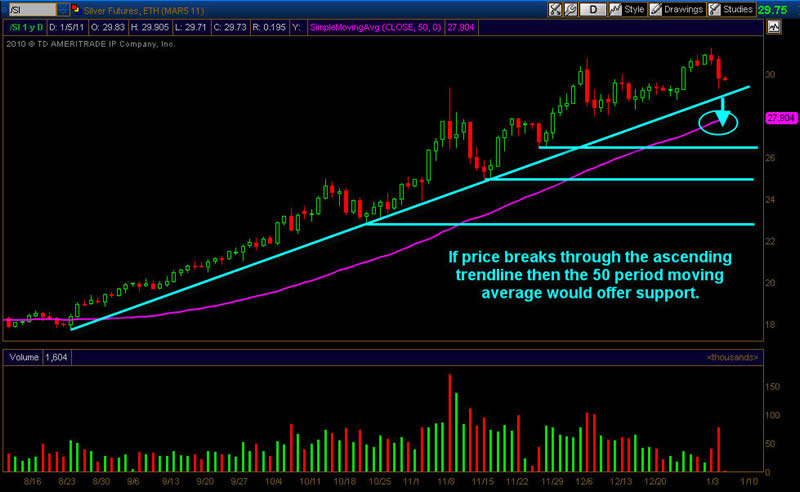
If price action yesterday is any indication of what may be in store for gold and silver investors a nasty correction or pullback may be likely. I have been warning about the possibility of such an event and as usual have received countless emails and even some veiled threats. Gold may go up for years, but most assets do not trade straight up. Price ebbs and flows with the marketplace and buyers and sellers come together in the process of price discovery.
If this is the start of a correction in gold, a potentially outstanding purchasing opportunity is possible for patient traders and investors. While the gold bugs fill up my email inbox with hate mail, I wait patiently to enter at lower prices while they remain in denial. The daily charts of gold and silver futures below illustrate key support levels which would likely offer solid risk / reward entries.
Gold Futures Daily Chart
Silver Futures Daily Chart
Bonds
For most traders and investors that started their careers in the 1980's, they have witnessed a bull market in bonds as yields went from double digits to the lowest interest rates in history over the past 20-30 years. New all time records could be set in the future, but strong fundamental headwinds exist. Overexposure to bonds could prove dangerous and diversification regarding duration, currency exposure, and geography remains paramount.
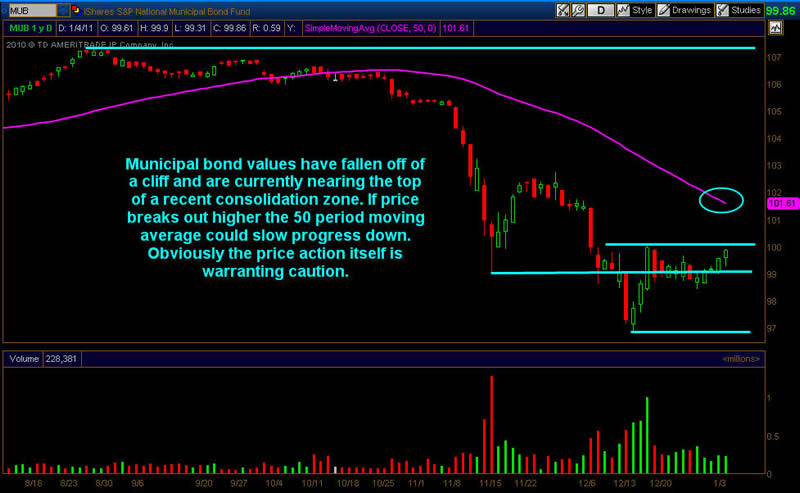
Many pundits and economists are showing considerable concern with regards to municipal and treasury bonds. Defaults are being discussed openly in the municipal space and there is additional concern that interest rates could continue to rise on U.S. Treasury obligations against the Federal Reserve's wishes. Both scenarios are not pleasant and certainly would impact bond pricing. Municipals have been under pressure which is evident from the daily chart of MUB shown below. Additionally I have displayed a weekly TLT chart with additional technical analysis.
MUB Daily Chart
TLT Weekly Chart
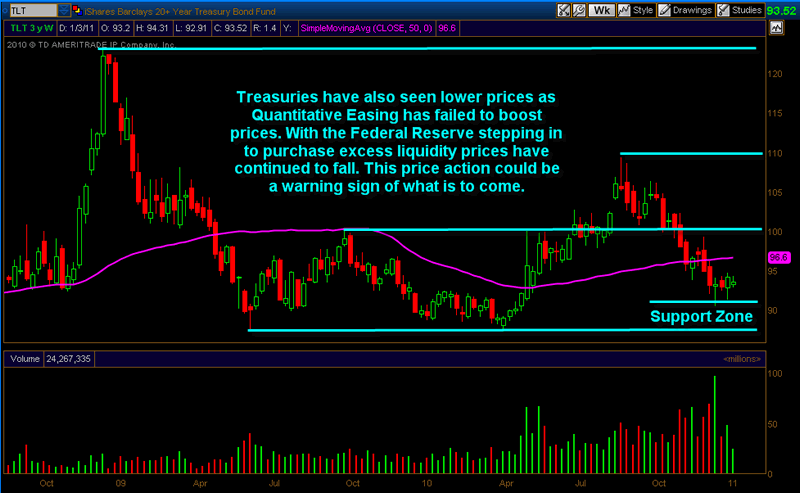
I have no idea what is going to happen over the next 12 months in financial markets. What I do know is that equities, precious metals, and bonds have been providing outstanding returns for over a year. While I realize that there are fundamental and technical drivers impacting the price action, I would be remiss if I did not remind traders and investors that taking profits is never a bad strategy. While all three asset classes may power higher by the end of the year, at some point in 2011 it is possible that all three asset classes may potentially go through a pullback. By taking profits, traders allow themselves the opportunity to put fresh capital to work at potentially lower prices sometime in the future.
A patient trader who uses fresh capital to buy assets at lower prices compounds his/her returns while selling when prices are relatively high and buying when prices move lower. By no means am I saying to sell everything and move to cash, but when bullish sentiment is so pronounced and the price action looks extremely overbought, taking profits is something worth considering. At some point we know at least one of these asset classes will lag going forward simply because it has been working well for such a long time.
Statistical probability dictates that every month that passes with higher prices brings us closer to a correction or pullback. Those who are prudent and take profits while raising cash levels along the way will have capital to take advantage of lower prices. In addition to taking profits, investors should also consider moving stops and limiting their risk profile. There will always be new opportunities, but replenishing capital is seemingly harder by the day.
If you would like to continue learning about the hidden potential options trading can provide please join my FREE Newsletter: www.OptionsTradingSignals.com
J.W. Jones is an independent options trader using multiple forms of analysis to guide his option trading strategies. Jones has an extensive background in portfolio analysis and analytics as well as risk analysis. J.W. strives to reach traders that are missing opportunities trading options and commits to writing content which is not only educational, but entertaining as well. Regular readers will develop the knowledge and skills to trade options competently over time. Jones focuses on writing spreads in situations where risk is clearly defined and high potential returns can be realized.
This article is intended solely for information purposes. The opinions are those of the author only. Please conduct further research and consult your financial advisor before making any investment/trading decision. No responsibility can be accepted for losses that may result as a consequence of trading on the basis of this analysis.
© 2005-2022 http://www.MarketOracle.co.uk - The Market Oracle is a FREE Daily Financial Markets Analysis & Forecasting online publication.


