


Bearish Gold Wave Patterns and Stock Market SP 500 Near The Top
Stock-Markets / Financial Markets 2011 Jan 17, 2011 - 09:55 AM GMTBy: David_Banister

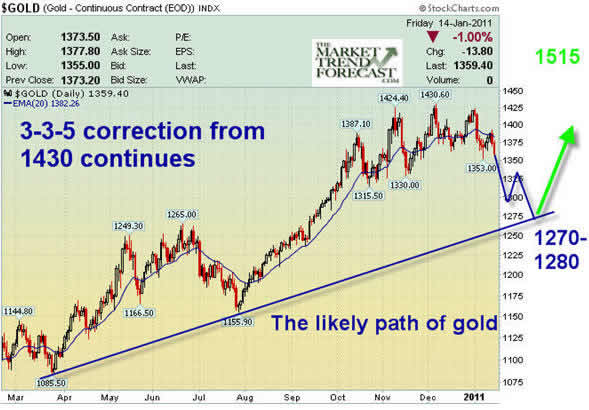
 My most recent forecasts for the SP 500 and Gold have been calling for interim peaks in both around Mid- January. Gold, I told my subscribers a few weeks ago, was definitely topping and likely to drop now to $1270-$1280 per ounce before resuming the Bull Market advance. The SP 500 I have forecasted a 1285-1315 topping area since the 1175 pivot lows on that index, and we are very close as well in that regard.
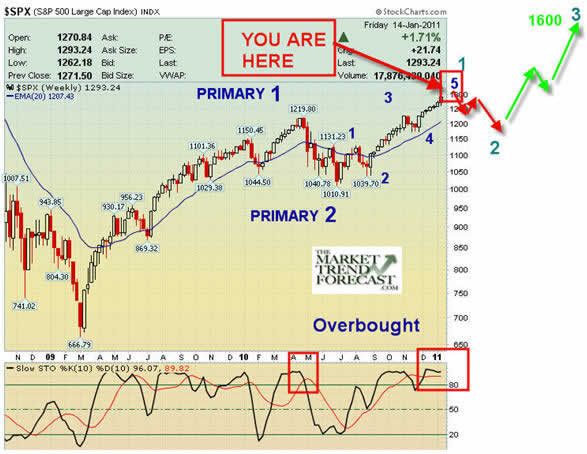
Gold has been in a 9 plus year bull market since 2001 and has another 3 years plus left on this Bull run. However, pauses must occur along the way and this should be a 4th wave corrective Elliott pattern if my views are right. This is taking the form of a 3-3-5 correction from the $1430 top. We are in the final 5 waves down now, and it’s about to get ugly near term so strap on your seatbelts. My chart forecast is below and if I’m right, there will be excellent opportunities to pick up some good Juniors and also the precious metals themselves around that $1270-$1280 area. Following this correction, we could have a run to about $1515 per ounce, and I expect this entire pattern to take 6 monthsl months to a year to play out from the $1430 top to the $1270 ish bottoms, and back to $1515.
The SP 500 is completing the final 5th wave movement from the 1010 Jul 1st lows this past summer. This is only the first full wave pattern movement of a big 5 wave leg up from July 1st. What this means in English is we have a near term top likely in the 1285-1315 areas, followed by a wave 2 correction to around the 1175-1180 areas. Sentiment right now is running at major extremes last seen at interim peaks in January of 2010 and April of 2010 where I had also forecasted tops within days of the peaks. I am looking for the SP 500 to end up around 1600 on the index after this coming wave 2 correction, but I like to take it one pivot and step at a time. Below is my forecast chartwise:
If you would like to benefit from learning more about Elliott Wave based forecasting using my methods, which have been historically accurate, please check us out at www.marketrendforecast.com There is a coupon available if you’d like to subscribe or you can sign up for free occasional reports.
Dave Banister
CIO-Founder
Active Trading Partners, LLC
www.ActiveTradingPartners.com
TheMarketTrendForecast.com
Dave Banister is the Chief Investment Strategist and commentator for ActiveTradingPartners.com. David has written numerous market forecast articles on various sites (SafeHaven.Com, 321Gold.com, Gold-Eagle.com, TheStreet.Com etc. ) that have proven to be extremely accurate at major junctures.
© 2011 Copyright Dave Banister- All Rights Reserved
Disclaimer: The above is a matter of opinion provided for general information purposes only and is not intended as investment advice. Information and analysis above are derived from sources and utilising methods believed to be reliable, but we cannot accept responsibility for any losses you may incur as a result of this analysis. Individuals should consult with their personal financial advisors.
© 2005-2022 http://www.MarketOracle.co.uk - The Market Oracle is a FREE Daily Financial Markets Analysis & Forecasting online publication.