Stock Market SPX Reverses from Cycle Top Resistance
Stock-Markets / Financial Markets 2011 Jan 30, 2011 - 07:06 AM GMT

 The FDIC Expands the Problem Bank List. -
The FDIC Failed Bank List announced four new bank closures this week. Before BankUnited FSB collapsed in May 2009, employees lit candles and prayed that Florida's biggest bank would survive the bad loans it made before the housing bubble burst. The miracle came in the form of Uncle Sam, or more precisely, the Federal Deposit Insurance Corp., which sold the failed BankUnited to a group of Wall Street financiers led by a longtime New York banker. The FDIC agreed to reimburse as much as $10.5 billion in future loan losses—and gave the new owners $2.2 billion in cash. The buyers paid $945 million.
The FDIC Expands the Problem Bank List. -
The FDIC Failed Bank List announced four new bank closures this week. Before BankUnited FSB collapsed in May 2009, employees lit candles and prayed that Florida's biggest bank would survive the bad loans it made before the housing bubble burst. The miracle came in the form of Uncle Sam, or more precisely, the Federal Deposit Insurance Corp., which sold the failed BankUnited to a group of Wall Street financiers led by a longtime New York banker. The FDIC agreed to reimburse as much as $10.5 billion in future loan losses—and gave the new owners $2.2 billion in cash. The buyers paid $945 million.
Stocks Drop Worldwide as Oil, Dollar Surge After Egypt Protests (Bloomberg) Stocks worldwide plunged the most since November, crude oil posted the biggest jump since 2009 and the dollar rose versus the euro after protesters posed the biggest challenge to Egyptian President Hosni Mubarak’s 30-year rule. Egypt’s dollar bonds sank, pushing yields to a record. The MSCI World All-Country World Index of stocks in 45 countries lost 1.4 percent at 4:59 p.m. New York time. The Dow Jones Industrial Average fell 1.4 percent to 11,823.70, preventing its longest weekly winning streak since 1995. Oil futures increased 4.3 percent to $89.34. The dollar appreciated 0.9 percent to $1.3611. Gold futures jumped 1.7 percent, the most in 12 weeks.
Quant Wipeout In Process?
(ZeroHedge) Something scary this way comes from Morgan Stanley's Quantitative and Derivative Strategies: "market conditions over the last two weeks are somewhat reminiscent of that during the August 2007 ‘Quant Crisis’. In only a few days, a number of quantitative long-short equity funds experienced unprecedented losses in seemingly ‘normal’ market conditions.
VIX broke above its 10-week moving average.
 --The VIX broke out of its 10-week moving average and is on a buy signal. This, of course, becomes an early sell signal for equities. It has yet to break out of its declining Broadening Wedge, which would imply a resumption of the trend involving a probable Flash Crash.
(Dow Jones)--The stock market's "fear gauge" leapt to its highest level in nearly two months Friday. But for some options strategists, it is the wrong time to hide in a bunker. Traders reached for protective options as they eyed the trio of unrest in Egypt, disappointing bellwether earnings and Nasdaq OMX Group Inc.'s (NDAQ) index glitches. As stocks slid, the Chicago Board Options Exchange Market Volatility Index, or VIX, surged 24% to levels not seen since Dec. 2. The VIX tends to jump when stocks fall. It closed 3.89 higher, up 24%, at 20.04.
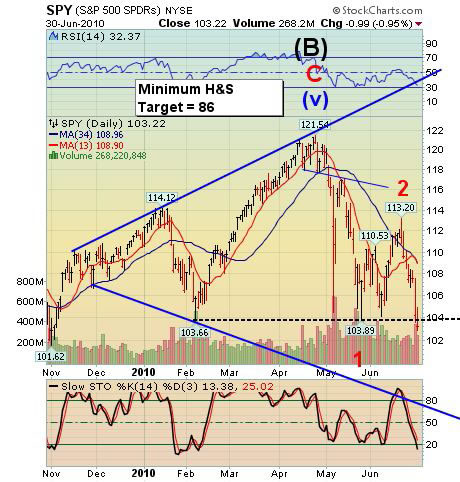
SPX reverses from Cycle Top Resistance.
 SPX reversed below weekly Cycle Top Resistance at 1315 on Friday. A new cycle pattern was discovered that called for a top on Thursday and a reversal on Friday. We have been seeing a cluster of Pivots from the first of the year. Each Pivot brought yet another sector into reversal until, finally, the DJIA and SPX succumbed this week.
Intermediate-term Trend Support and the trendline for the August low are at 1260-1265. Many traders will wait for a cross-over of the 10 week moving average at 1256.73 to short the SPX. A Flash Crash may bring the SPX below the Summer low once these supports are crossed. As I examined one of my old weekly charts, something jumped out that I had not seen before. The SPX has just retested its H&S Neckline from the 2008 crash.
The NDX closed below Cycle Top Resistance.
 --The NDX retested its weekly Cycle Top Resistance at 2357.00, then closed near its intermediate-term Trend Support and trendline at 2260.98 (not shown). The NDX ended the week back on a sell signal and awaits the cross of the 10-week moving average for a weekly confirmation. The May Flash Crash started once the intermediate-term Trend Support was crossed.
Margin debt edged up 0.9% in December, again climbing to a new high since the 2008 financial crisis, according to the New York Stock Exchange. At the end of December, margin debt totaled $276.6 billion, up from $274 billion at the end of October and the highest level since September 2008, according to Big Board data for customers of NYSE-member securities firms.
Gold tests the lower trendline of its Diagonal.
 -- Gold reversed down out of its throw-over and tested the lower trendline of its 2-year old Diagonal formation in a combination Trading Cycle and Primary Cycle low last week. The bounce that followed may have given some relief from margin calls to leveraged investors, but it may not have much further to go. The 10-week moving average is directly overhead at 1374.47.
Over the past several weeks there had been rumors that the reason for the precipitous drop in gold was primarily driven by a hedge fund liquidating its futures positions. This has now been confirmed: "Yeah, that was just me liquidating my spread position," Mr. Daniel Shak, [of SHK Asset Management] 51 years old, said in an interview. "I had a significant, fully margined position.”
$WTIC ready to decline below its 10-week moving average.
 -- $WTIC violated its 10-week moving average at 88.14, but is managed to close above it on Friday. The entire Commodities Index had what appears to be a Master Cycle low between January 25 and 28. The Flash Dash retracement has reached the 55% level at the close and has already been repelled at intermediate-term Trend Resistance at 89.73. Over the past few weeks we have dedicated quite a few articles to the WTI-Crude spread which today once again hit an all time record wide. Yet no matter the reason for the divergence, what is certainly lacking are explanations for why arbitrageurs have not stepped in to take advantage of this mispricing. While there has been much speculation, nobody has provided a comprehensive answer. Until today.
The Bank Index repelled by its Cycle Top Resistance.
 --The $BKX spent its fourth week just under Cycle Top Resistance at 55.82 and completed a probable right shoulder to a massive Head and Shoulders pattern. The Master Cycle high for BKX occurred the week ending on January 14th. It appears ready for the break below its 10-week moving average.
To get to the heart of what went wrong with the report released yesterday by the Financial Crisis Inquiry Commission, check out its account on page 254 of how the largest investor in a cash fund managed by Bank of America suddenly pulled out $20 billion of its money in November 2007.
The Shanghai Index trades at mid-Cycle Support.
 --The Shanghai Index made its weekly close above its mid-Cycle Support. This gives some credence to the idea that there may be one more push higher before the collaps that everyone is calling for in China. The inverted H&S neckline is still operative, but a rally above the 10-week moving average at 2819.03 is necessary to confirm that pattern. The declining wave pattern appears corrective, indicating a probable move higher.
However, the 1week SHIBOR rate is still extremely high.
$USB may be building a base.
 -- $USB has now spent an entire month just above its daily Cycle Bottom support at 118.88. It is still within its descending Broadening Wedge, which is a continuation formation. This week’s action brought $USB above its intermediate-term Trend RSupport/Resistance and on a daily buy signal. A weekly close above its 10-week moving average will confirm the buy signal on the weekly chart. The riots in Africa and the Middle East may have been the catalyst for Treasuries to start their rally. Bonds have been oversold since the first week of January.
$USD retracement may be over.
 -- $USD was due to end its Primary Cycle decline at the end of the week. The $USD completed a 66% retracement on Thursday and began its reversal on Friday. It is now due for a sharp rally that may take it to the upper trendline by the end of February.
Goldman Sachs said in a research note on Friday it closed its long euro/dollar position because a "lack of additional catalysts" has kept the currency pair range bound for now.
Yeah, right. It was “Talking its book” a week ago to get investors to take its trades.
Traders alert: The Practical Investor is currently offering the daily Inner Circle Newsletter to new subscribers. Contact us at tpi@thepracticalinvestor.com for a free sample newsletter and subscription information.
Our Investment Advisor Registration is on the Web
We are in the process of updating our website at www.thepracticalinvestor.com to have more information on our services. Log on and click on Advisor Registration to get more details.
If you are a client or wish to become one, please make an appointment to discuss our investment strategies by calling Connie or Tony at (517) 699-1554, ext 10 or 11. Or e-mail us at tpi@thepracticalinvestor.com .
Anthony M. Cherniawski, President and CIO http://www.thepracticalinvestor.com
As a State Registered Investment Advisor, The Practical Investor (TPI) manages private client investment portfolios using a proprietary investment strategy created by Chief Investment Officer Tony Cherniawski. Throughout 2000-01, when many investors felt the pain of double digit market losses, TPI successfully navigated the choppy investment waters, creating a profit for our private investment clients. With a focus on preserving assets and capitalizing on opportunities, TPI clients benefited greatly from the TPI strategies, allowing them to stay on track with their life goals
Disclaimer: The content in this article is written for educational and informational purposes only. There is no offer or recommendation to buy or sell any security and no information contained here should be interpreted or construed as investment advice. Do you own due diligence as the information in this article is the opinion of Anthony M. Cherniawski and subject to change without notice.
Anthony M. Cherniawski Archive |
© 2005-2022 http://www.MarketOracle.co.uk - The Market Oracle is a FREE Daily Financial Markets Analysis & Forecasting online publication.