


Trading the U.S. Treasury Bond Market With Success
Interest-Rates / US Bonds Mar 04, 2011 - 02:22 AM GMTBy: readtheticker

 If you are an avid reader of financial articles, you will have seen many stock charts with all types of technical analysis drawn upon it. You name it, you're seen it, trend lines, moving averages, oscillators, Elliot wave counts, etc. Yet you fail to see a simple technique that assisted a young trader to make millions.
I do not know how else to convey the point that 'William Gann Angles' are one the simplest and smartest way to read stock charts. Here are a few reasons as to why the reader does not see 'Gann Angles' used more: (1) they have yet to be provided to the masses correctly. I know of several well known online charting services and the name 'Gann' is not on the 'tool' list. (2) Another reason maybe that the feel the trend line substitutes the need for 'Gann Angles'. The only problem with that is a trend line generally requires two pivot points to draw (excluding vertical and horizontal lines) where as the angle line requires only one.
I shall, hopefully prove to you that 'Gann Angles' do have a place in your technical analysis charting tool set. Lets review the TNX (US 10 year bond yield) from 2009 to 2011. This back test will hopefully win over your confidence for the next trade we see in 2011.
'Gann angles' can be considered a speed test or how well price is moving relative to time. For example a 1x1 or 45 degree angle has price moving 1 unit for every 1 unit of time. A 1x2 angle has price moving 2 units for every 1 unit of time. The latter is obviously more beneficial for your portfolio.
Before we can draw a true Gann Angle we must setup our chart scale to be a true square of time to price or 1x1.
The charts that follow have these specifications: Time: 875 days Price: 3 yield points Price Adjust: x100 xAxis: 805 divided by 875 = 0.92 pixels per time units yAxis: 276 divided by (3 x 100) = 0.92 pixels per price units. The chart is a true square of time to price, as time of 0.92 units equals price of 0.92 units.
TNX 2008 to 2009
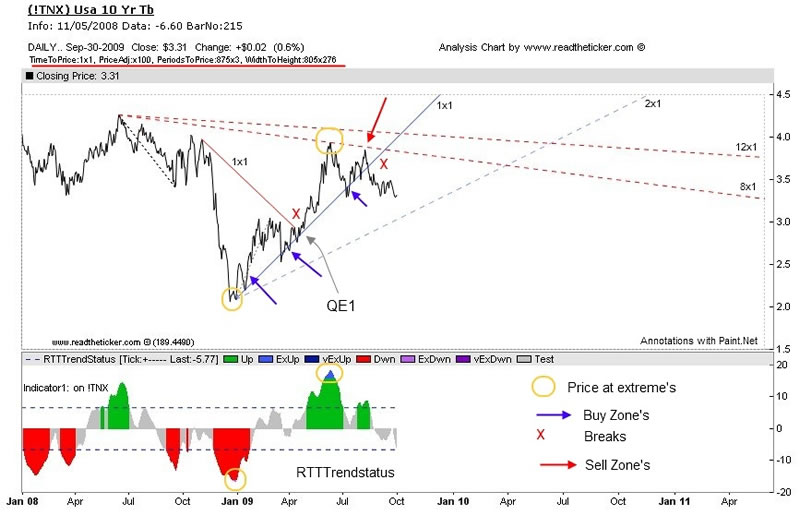
The TNX crashed late 2008 at the height of the financial crisis. Buying the TNX was successful along the blue 1x1 (45 degree) line until August 2009. The RTTTrendstatus in May 2009 signaled by a change in color that price was at an extreme level and a profit taking could be expected, also the TNX just pipped the falling 8x1 angle. In Sept 2009 the TNX broke the blue 1x1 angle, and it was 'wait and see' until the TNX it hits or breaks the blue 2x1 line. Of course the bond yield rally was in response to QE1 (quantitative easing) program from the US Federal Reserve.
TNX 2009 to 2010
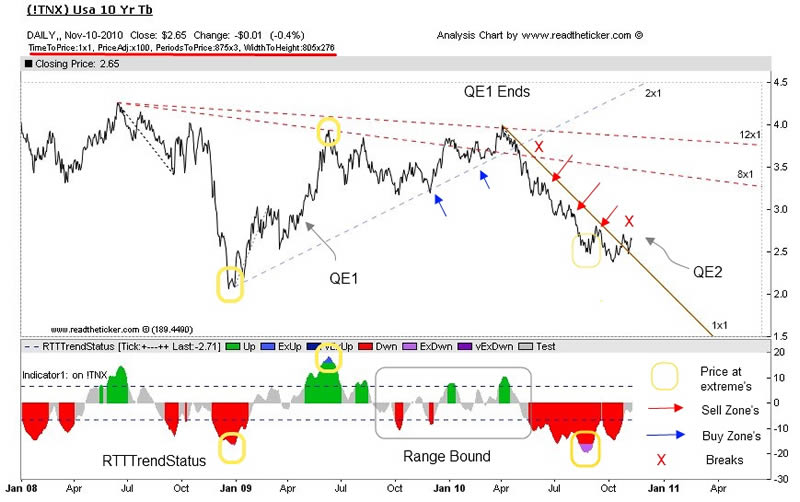
The TNX yield eventually found support along the rising blue 2x1 angle and followed it until yields hit 4.0% in March 2010. The yield did break the 8x1 angle but failed at the 12x1. Just as QE1 ended. The TNX started to price in deflation and broke down through the blue 2x1 angle and traded all the way down to 2.5%, this was supported by the brown 1x1 angle. The RTTTrendstatus signaled by a change in color that yields had moved to far too quick and a pullback was expected. Talk of QE2 forced a break of the brown 1x1 angle late 2010.
TNX 2010 to 2011
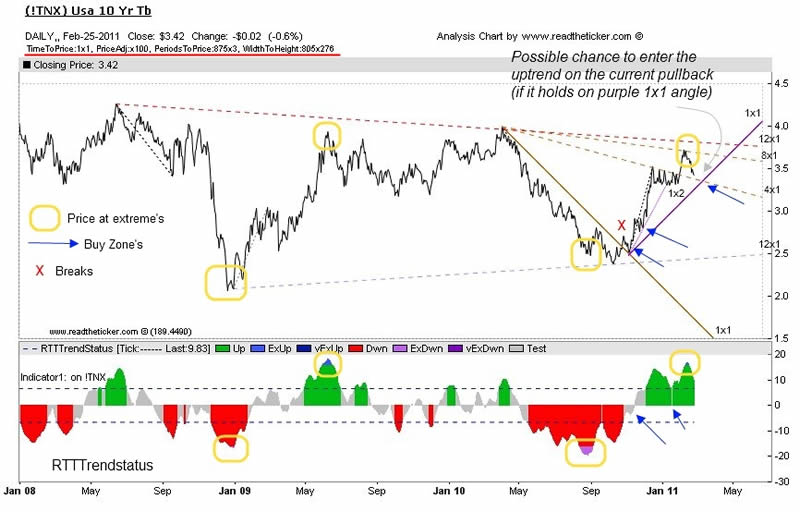
QE1 raised the TNX yield in 2009 history has repeated in 2011 with QE2. Yields rallied hard along the purple 1x2 angle, pausing at the brown 4x1 angle with a final punch up to the brown 8x1. We are now seeing a possible trade when the TNX tests at the rising purple 1x1 (ETF TBT or IEF). The recent fall in yields has been a called a 'flight to safety' while Middle East makes news or it may be simply profit taking by the bond bears. No matter, we do not think the rally in 10 year yield is over.
Please note a very important point when viewing the third chart, you see the falling 12x1 red angle and a rising 12x1 blue angle, at first you would think that these are trend lines with two connecting pivots, but they are Gann angles lines requiring one pivot on the chart to draw and price at a latter stage pips the angle line exactly. That is technical accuracy for you !
The accuracy you see with Gann Angles on the TNX is easily replicated on other securities (Gold, Silver, Stocks, US Dollar etc). They are our first 'go to' chart tools. Drawing Gann Angles on the correct 1x1 scale with true angle degrees makes all the difference. Of course accuracy shoots higher when you add our Hurst Cycle tools.
The RTTTrendStatus indicator is great for highlighting a trends performance and how far price has moved from its mean. You can learn the rules behind this tool on our site here.
Readtheticker
My website: www.readtheticker.com
My blog: http://www.readtheticker.com/Pages/Blog1.aspx
We are financial market enthusiast using methods expressed by the Gann, Hurst and Wyckoff with a few of our own proprietary tools. Readtheticker.com provides online stock and index charts with commentary. We are not brokers, bankers, financial planners, hedge fund traders or investment advisors, we are private investors
© 2011 Copyright readtheticker - All Rights Reserved
Disclaimer: The material is presented for educational purposes only and may contain errors or omissions and are subject to change without notice. Readtheticker.com (or 'RTT') members and or associates are NOT responsible for any actions you may take on any comments, advice,annotations or advertisement presented in this content. This material is not presented to be a recommendation to buy or sell any financial instrument (including but not limited to stocks, forex, options, bonds or futures, on any exchange in the world) or as 'investment advice'. Readtheticker.com members may have a position in any company or security mentioned herein.
© 2005-2022 http://www.MarketOracle.co.uk - The Market Oracle is a FREE Daily Financial Markets Analysis & Forecasting online publication.