


Do or Die Week for Stocks and Gold
Stock-Markets / Financial Markets 2011 Mar 13, 2011 - 02:27 PM GMTBy: Chris_Vermeulen

 The past couple weeks have been choppy in the equities market. While the strong intraday moves are great for day traders, it is extremely difficult for swing/position traders who normally hold positions for 3-60 days in length, which is my focus with this newsletter. That being said, we are reaching a do or die point for the equities market and next week there should be a strong move out of this trading range.
On the volume side of things, we have been seeing distribution taking place. Heavy volume continues to step into the market unloading large amounts of shares. The interesting part is that the majority of traders are bullish and sentiment levels are at extremes. Also, we are seeing the retail trader enter the market… What does this mean? It means we must trade very cautious and large positions on the long side shouldn’t be taken. The selling volume and extreme bullish sentiment are warning us that a correction is near.
There are a few things I watch to identifying trend reversals and they are accumulation or distribution of shares, Extreme sentiment readings, Market internals/breadth, and if the price relative to the 20 SMA. Currently we are seeing all the signs of a reversal to the down side, but it has yet to be confirmed.
My trading buddy JW Jones who focuses strictly on Options Trading has been cleaning up with the current volatility making 21%, 50% and 67% returns on his last three trades. This guy loves volatility and always seems to put together an option play with very little risk yet big upside potential.
Let’s take a look at a couple charts…
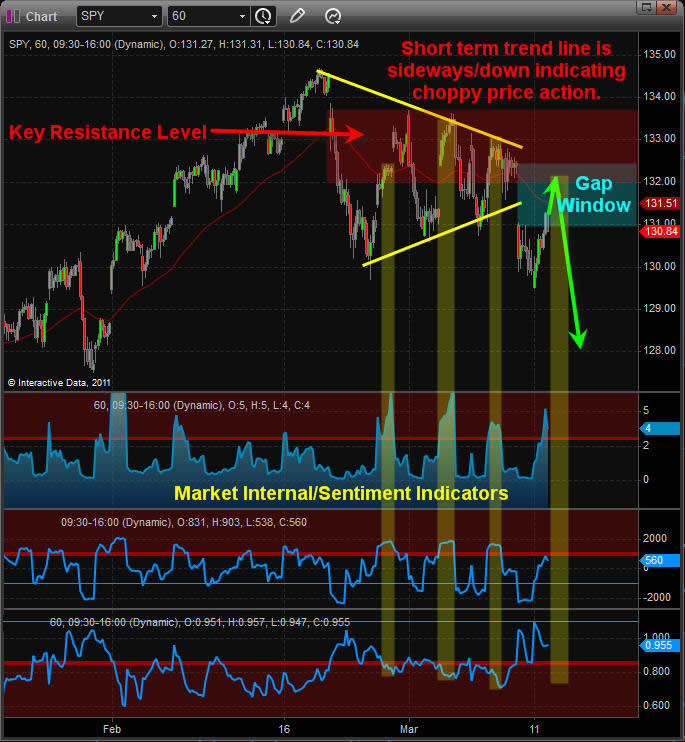
SP500 60 minute chart going back 2 months
This chart shows a possible trend reversal unfolding. We are seeing distribution selling, lower prices with the current price trading under a key resistance level. Also my internal/sentiment indicators are showing waves of buying/bullish market action which is quickly met with strong selling pulling prices back down.
Trading during trend reversals is difficult because the potential downside risk is higher when entering a position. If traded, only small positions should be taken until a trend is established, then you can build/add to your position on pullbacks or bounces depending on the direction in your favor.
My current bias is for lower prices in the coming days, but until we break above February’s high or Last week’s low with strong volume it’s a little more of a guessing game. If we see the SP500 rise early next week and fill the gap and the market internal indicators show extreme short term overbought conditions, it will make for another great low risk shorting opportunity. Shorting just under a key resistance level means the protective stop is only 1-2% away from our entry point and makes for a solid 1:3 risk/reward ratio. On the flip side, if the market has a strong rally and closes above the key resistance level then the tables will have turned and a new up trend should start.
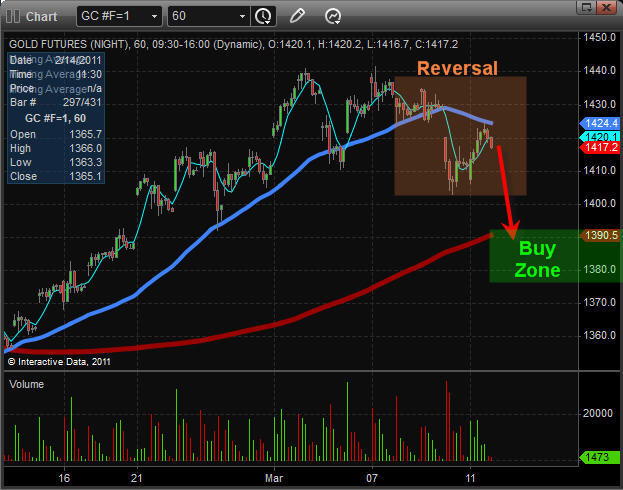
Gold 60 Minute Chart going back 2 months
Gold has had a nice push up in the past few weeks due to the issues in the Middle East. We saw this yellow metal make a new high but has since pulled back down and could have another move lower in the coming week. The $1380-1390 level should act as a strong support zone. The daily and 60 minute chart both show support at that area. Silver is in the same boat. Keep an eye this…
Weekend Trend Analysis:
In short, stocks and commodities are nearing a tipping point and there should be a large move in either direction starting this week if all goes according to plan. The big question is which way are prices going to go? My current bias is for more downside until we see a good washout in the market. It could be 2-8% lower from where the market closed on Friday. After that I think a grind higher into May could easily take place but we will see how the charts unfold going forward.
Each week there seems to be some type of surprise economic, political or natural disaster of some sort making trading not only tougher to trade but riskier because price swings are large. Keep trading to a minimum and small for now.
If you would like to get more of my daily analysis to join my newsletter at www.GoldAndOilGuy.com
By Chris Vermeulen
Chris@TheGoldAndOilGuy.com
Please visit my website for more information. http://www.TheGoldAndOilGuy.com
Chris Vermeulen is Founder of the popular trading site TheGoldAndOilGuy.com. There he shares his highly successful, low-risk trading method. For 6 years Chris has been a leader in teaching others to skillfully trade in gold, oil, and silver in both bull and bear markets. Subscribers to his service depend on Chris' uniquely consistent investment opportunities that carry exceptionally low risk and high return.
This article is intended solely for information purposes. The opinions are those of the author only. Please conduct further research and consult your financial advisor before making any investment/trading decision. No responsibility can be accepted for losses that may result as a consequence of trading on the basis of this analysis.
© 2005-2022 http://www.MarketOracle.co.uk - The Market Oracle is a FREE Daily Financial Markets Analysis & Forecasting online publication.