


Japan's Nikkei Stocks Bear Market Resumes
Stock-Markets / Japanese Stock Market Mar 28, 2011 - 08:14 AM GMTBy: Tony_Caldaro

 During the past several weeks Japan has experienced a number of devastating natural and manmade disasters. In the months and years ahead Japan will certainly recover, and the global community will assist them in their endeavors. As a result of these recent events we have reviewed the long term charts to determine the impact on investor psychology for Japanese investments for the next several years.
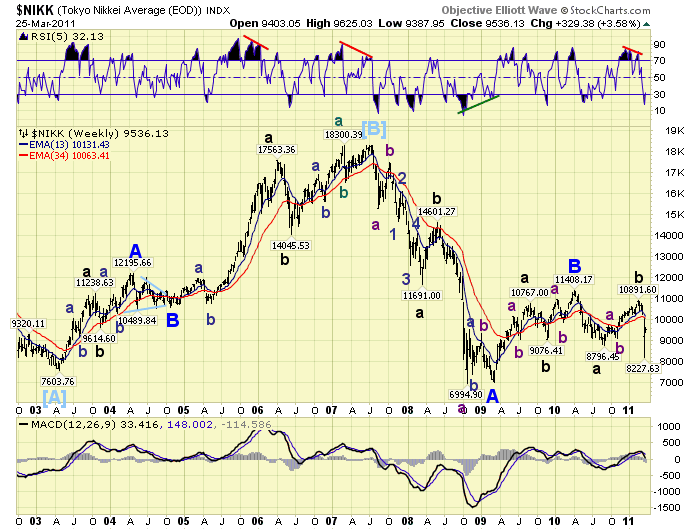
We had not published much on the Nikkei index during the past few years. The long term wave patterns were decidedly bearish into 2009. Then they displayed some choppy activity into 2011 which suggested a potential fragile recovery was underway. After the earthquake/tsumami, however, long term investor psychology took a significant downturn. The fragile 2009-2011 recovery ended abruptly as a counter rally in a larger bear market. The Grand Supercycle bear market that has been underway since 1989.
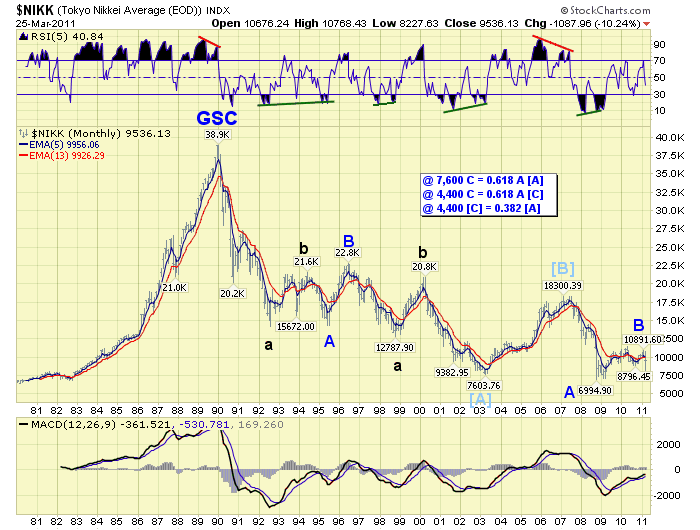
The monthly chart displays the entire GSC bear market. Observe the three Primary wave ABC decline from 1989 and NIKK 38,900 to 2003 and NIKK 7,600. This entire decline is labeled Cycle wave [A]. From 2003 to 2007 we get a Cycle wave [B] advance to NIKK 18,300. What follows is another three Primary wave ABC decline that will form Cycle wave [C]. Primary waves A and B have completed. The Nikkei has been in Primary wave C of Cycle wave [C] since the spring of 2010.
We note some interesting Fibonacci price relationships on the monthly chart. During Cycle wave [A] Primary C = 0.618 Primary A at NIKK 7,600. Using the same relationship for Cycle wave [C] we arrive at NIKK 4,400. Also at NIKK 4,400 Cycle wave [C] = 0.382 Cycle wave [A]. Therefore we are expecting a final end to the multi-decade Japanese bear market around NIKK 4,400 within the next few years. You can track the Nikkei along with us by scrolling down page 8 using the following link:
CHARTS: http://stockcharts.com/def/servlet/Favorites.CServlet?obj=ID1606987
http://caldaroew.spaces.live.com
After about 40 years of investing in the markets one learns that the markets are constantly changing, not only in price, but in what drives the markets. In the 1960s, the Nifty Fifty were the leaders of the stock market. In the 1970s, stock selection using Technical Analysis was important, as the market stayed with a trading range for the entire decade. In the 1980s, the market finally broke out of it doldrums, as the DOW broke through 1100 in 1982, and launched the greatest bull market on record.
Sharing is an important aspect of a life. Over 100 people have joined our group, from all walks of life, covering twenty three countries across the globe. It's been the most fun I have ever had in the market. Sharing uncommon knowledge, with investors. In hope of aiding them in finding their financial independence.
Copyright © 2011 Tony Caldaro - All Rights Reserved Disclaimer: The above is a matter of opinion provided for general information purposes only and is not intended as investment advice. Information and analysis above are derived from sources and utilising methods believed to be reliable, but we cannot accept responsibility for any losses you may incur as a result of this analysis. Individuals should consult with their personal financial advisors.
© 2005-2022 http://www.MarketOracle.co.uk - The Market Oracle is a FREE Daily Financial Markets Analysis & Forecasting online publication.