


Stocks, U.S. Dollar, and VIX Not Anticipating Negative Reaction to Fed QE Meeting
Stock-Markets / Financial Markets 2011 Apr 27, 2011 - 03:03 AM GMTBy: Chris_Ciovacco

 Experience tells us the best approach to this week’s Fed trifecta (meeting, statement, and press conference) is (a) to be patient, (b) wait for the news to come out, (c) monitor the market’s reaction, and (d) make any adjustments to our allocation if needed. From a contingency planning perspective, it is helpful to study the markets for clues that may foreshadow the reaction to Wednesday’s Fed statement and press briefing.
The Fed’s recent press release contains an important time change related to this week’s statement:
In 2011, the Chairman’s press briefings will be held at 2:15 p.m. following FOMC decisions scheduled on April 27, June 22 and November 2. The briefings will be broadcast live on the Federal Reserve’s website. For these meetings, the FOMC statement is expected to be released at around 12:30 p.m., one hour and forty-five minutes earlier than for other FOMC meetings.
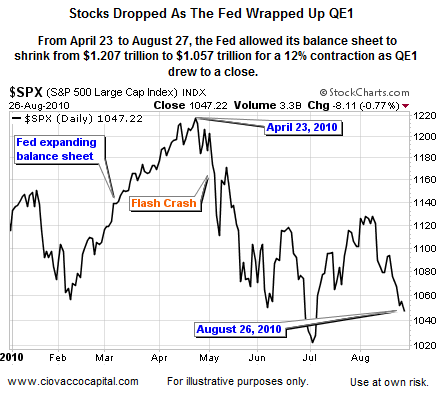
From a fundamental perspective there are reasons to be nervous about the approaching end of the Fed’s second quantitative easing program (QE2) and possible policy changes to begin mopping up some of the liquidity in the financial system. As we originally presented on March 14, the chart below shows the stock market’s negative reaction to the completion of QE1.
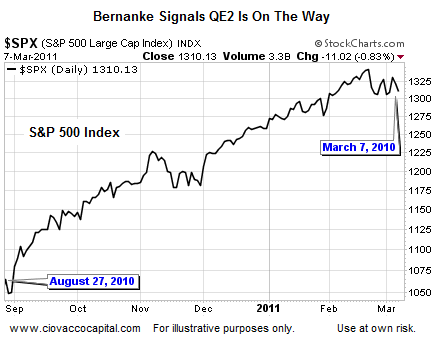
For those who doubt whether the end of QE2 is a significant event, the chart below shows the S&P 500’s performance after Ben Bernanke’s August 27, 2010 Jackson Hole speech, which basically told the markets QE2 was on the way.
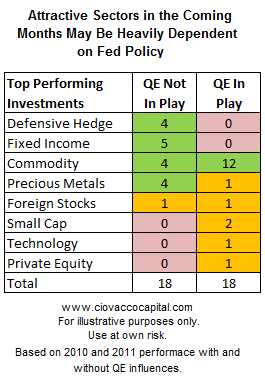
The table below shows where top-performing investments congregated post QE1 and after the Fed signaled QE2 (8/27/10 to 3/9/2011). The stark contrast between the left and right columns below tells us it is very important to look for a possible shift in risk appetite between now and the completion of QE2, which is scheduled to end in June.
The April 26 Wall Street Journal contained several articles about the end of QE2. The Journal highlighted our concerns as follows:
So far the Fed has bought $548 billion worth of Treasurys under QE2, according to a Barclays Capital tally, with maturities ranging from 1 1/2 to 30 years, and inflation-protected securities as well. The buying has made up more than 85% of the net $638 billion of bonds the government sold between November and March (Article).
“When QE2 ends in June, then $1.5 trillion worth of check-writing per year basically disappears,” says William Gross, who oversees the $1.2 trillion portfolio of Pacific Investment Management Co. “It will be a big event.” (Article)
Given all of the above, you would guess the stock market, dollar, and VIX would be sending signals foreshadowing a shift in risk appetite. While these signals may still emerge in the coming days and weeks, thus far, no such signals exist.
The stock market had an opportunity to “beat the Fed rush, and sell off early” on April 18 when Standard and Poor’s (S&P) moved to a negative outlook on U.S. debt. As we noted on April 19, the market’s sell-off following the S&P announcement was not as bad as it appeared. Since the low of 1,294 on April 18, the S&P 500 Index has tacked on 41 points.
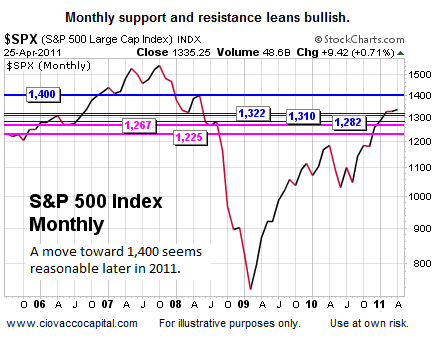
Shifting to simple support and resistance, the monthly chart of the S&P 500 below shows a market that has held above several key levels during the March pullback and following the S&P’s negative shift on U.S. debt. As we noted back on March 22, a move toward 1,400 on the S&P 500 is not out of the question.
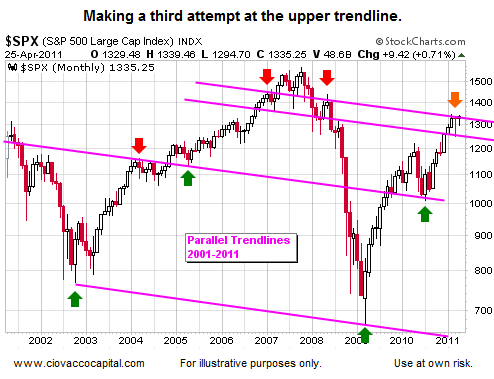
We have shown the longer-term chart of the S&P 500 below several times in 2011. The market bounced off the upper pink trendline early in the year in a bearish fashion (see orange arrow). Since then, stocks have clawed their way back from the March 16 intraday low of 1,249. The S&P 500 is now knocking on the upper-pink trendline’s door for the third time. This bullish resilience is impressive in the S&P’s debt wake and with the end of QE2 in sight.
When the markets are sending mixed signals or an advance appears questionable, as the current one does, it is helpful to take a step back and examine things from a longer-term perspective. The monthly chart of the S&P 500 below tells us to respect the possibility of bullish outcomes despite our Fed-related concerns. The top portion of the chart shows the Relative Strength Index (RSI). The S&P 500’s monthly RSI remains in a bullish trend channel. RSI has also recently cleared a point of possible resistance. If we compare point A to point B, we see RSI has exceeded the level at point A.
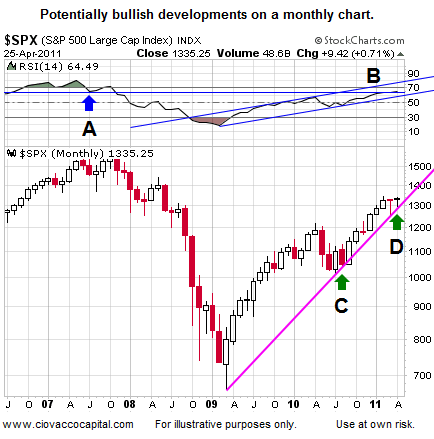
Staying with the chart above, the bullish pink trendline from the March 2009 lows was established near point C. The trendline has thus far been able to act as support for prices near point D. A bearish break of the pink trendline in the coming days and weeks could open the door to a pullback below 1,249.
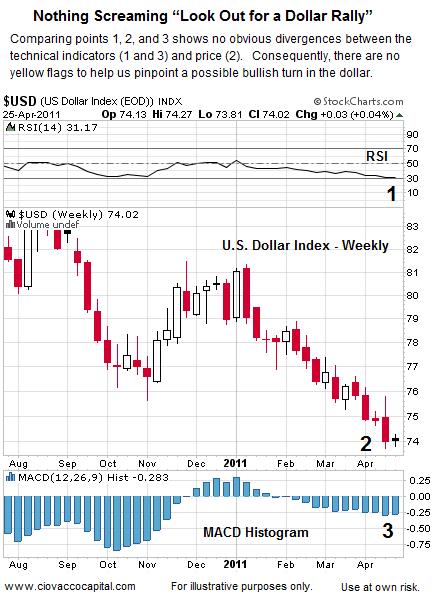
If we look for bearish clues in the currency markets, nothing jumps out in an obvious manner foreshadowing a possible “safe-haven” rally in the U.S. Dollar. One clue that may, emphasis on may, help us prepare for a possible change in trend is the presence of divergences between an indicator, such as RSI, and price. A bullish or positive divergence occurs when price makes a lower low and an indicator makes a higher low. Bullish divergences often are followed by rallies. As of the April 25 close, there are no divergences between the price of the U.S. dollar and two indicators commonly used to spot divergences, RSI (see top) and MACD Histogram (see bottom). This does not mean that the dollar will not or cannot rally; it simply means there is nothing currently present suggesting that a rally is imminent.
The April 25 Wall Street Journal also commented on the market’s expectations on interest rates, which leave the door open to further weakness in the dollar:
Markets currently anticipate the Fed will move to tighten credit at the very end of this year or early next. The economy, in other words, will remain awash in cheap credit. That view has helped to power the stock market recently.
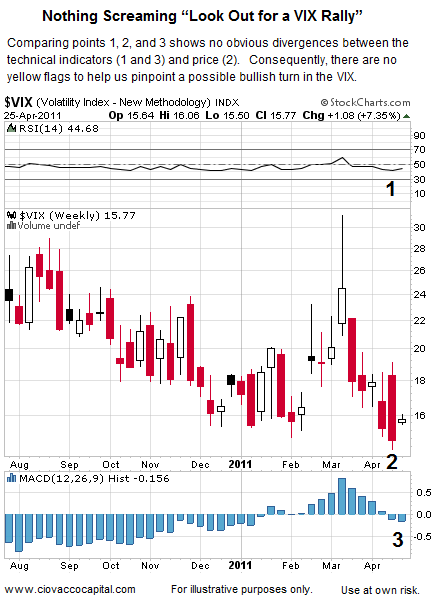
The VIX is commonly referred to on Wall Street as the “Fear Index”. The VIX tends to rise, and rise rapidly, when the markets experience a period of risk aversion. Like the dollar, there are no obvious divergences on the weekly chart of the VIX to suggest a period of risk aversion is imminent. The VIX may well stage a furious rally in the coming weeks, but divergences are not there to support such a move.
While nothing yet is all that alarming relative to our concerns about a possible change in risk appetite, the tentative move off the March 16 low, the April 27 Fed events, and expiration of QE2 warrant a close watch on our long positions, especially those in energy (XLE), commodities (DBC), precious metals (SLV), and materials (XLB). If evidence of a shift in the market’s tone surfaces, we will monitor the interest in more defensive-oriented positions, such as consumer staples (XLP), utilities (XLU), and bonds (AGG). Unlike the deflationary-scare-induced correction in 2010, the next bearish episode may be accompanied by a spike in interest rates, bringing into question the safe-haven status of utilities and bonds. If we pay attention with an open and unbiased-mind, the market’s longer-term reaction to the Fed and the end of QE2 will become clearer over the coming days and weeks.
By Chris Ciovacco
Ciovacco Capital Management
Copyright (C) 2011 Ciovacco Capital Management, LLC All Rights Reserved.
Chris Ciovacco is the Chief Investment Officer for Ciovacco Capital Management, LLC. More on the web at www.ciovaccocapital.com
Ciovacco Capital Management, LLC is an independent money management firm based in Atlanta, Georgia. As a registered investment advisor, CCM helps individual investors, large & small; achieve improved investment results via independent research and globally diversified investment portfolios. Since we are a fee-based firm, our only objective is to help you protect and grow your assets. Our long-term, theme-oriented, buy-and-hold approach allows for portfolio rebalancing from time to time to adjust to new opportunities or changing market conditions. When looking at money managers in Atlanta, take a hard look at CCM.
All material presented herein is believed to be reliable but we cannot attest to its accuracy. Investment recommendations may change and readers are urged to check with their investment counselors and tax advisors before making any investment decisions. Opinions expressed in these reports may change without prior notice. This memorandum is based on information available to the public. No representation is made that it is accurate or complete. This memorandum is not an offer to buy or sell or a solicitation of an offer to buy or sell the securities mentioned. The investments discussed or recommended in this report may be unsuitable for investors depending on their specific investment objectives and financial position. Past performance is not necessarily a guide to future performance. The price or value of the investments to which this report relates, either directly or indirectly, may fall or rise against the interest of investors. All prices and yields contained in this report are subject to change without notice. This information is based on hypothetical assumptions and is intended for illustrative purposes only. THERE ARE NO WARRANTIES, EXPRESSED OR IMPLIED, AS TO ACCURACY, COMPLETENESS, OR RESULTS OBTAINED FROM ANY INFORMATION CONTAINED IN THIS ARTICLE. PAST PERFORMANCE DOES NOT GUARANTEE FUTURE RESULTS.
Chris Ciovacco Archive |
© 2005-2022 http://www.MarketOracle.co.uk - The Market Oracle is a FREE Daily Financial Markets Analysis & Forecasting online publication.