U.S. Dollar Investors Reality Check - How Much is that Priced in Euros?
Stock-Markets / Financial Markets 2011 Apr 29, 2011 - 05:39 AM GMTBy: PhilStockWorld
 It’s as if 2008 never happened.
Once again the worlds investors are pumping up bubbles that will probably explode in their faces. After the popping of a real estate bubble led to the first global recession since the 1930s, world markets are frothing like shaken Champagne. Pundits claim to have spotted price increases that are unsupported by economic fundamentals in assets ranging from U.S. farmland to Israeli biotech to Australian housing to Chinese cemetery sites. Commodities have soared. Global junk-bond issuance hit a record in the first three months of the year … this is the granddaddy of them all, an almost-encompassing bubble right at the heart of monetary systems. - Peter Coy & Roben Farzad
Business Week has an excellent slide show on various bubbles that are in progress around the World and this article is a must read for fans of reality, as is Paul Farrel's "2008 Crash Deja Vu" from Market Watch (which follows on with my article from last week "How to Make 500% On the Next Crash" - which you'd better read too - just in case), in which he notes:
 Another crash is coming, unavoidable, just like 2008. Not because our totally dysfunctional government is collapsing into anarchy, thanks to the 261,000 Super-Rich Lobbyists. Not just because our monetary system is run by the Bernanke Printing Press Company. And not just because a soulless conspiracy of Wall Street CEOs cares nothing for democracy and the public interest, only for their stockholders and their year-end bonuses.
Another crash is coming soon because we’re back playing the same speculative games as we did for years prior to the 2008 crash. When we collapse, it will be because America’s leaders never learn the lessons of history. Never.
David Fry (his charts here) does a great job of summing up our strategy this morning of outlining the conflict we face as we are fundamentally disgusted with the markets and by the policies being set by our government but, for the sake of staying with the market, technically bullish. As David says: "It’s a con plain and simple. I’ve bought into it because I must. Overall we’re long and will be until the jig is up. Until then, I’ve advised subscribers for many months our Lazy Portfolios are the path to success as Fed policies steamroll most technical systems beyond HFTs. When it ends, and it will, it’s back to business as usual."
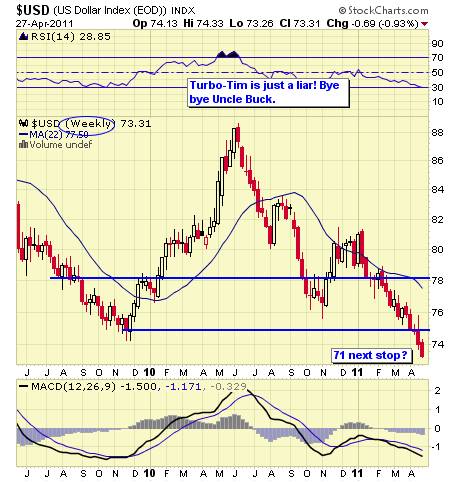
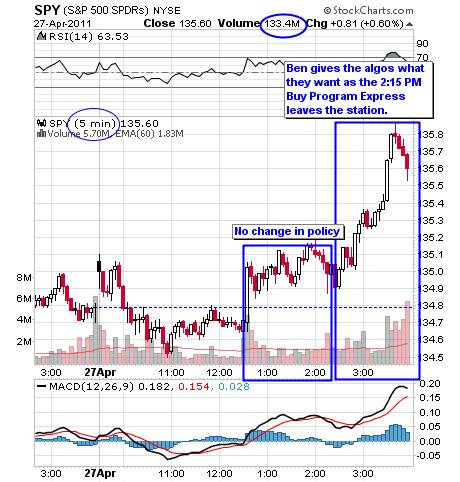 The great con of course remains current inflation which Bernanke alluded to briefly in his comments today. They cling to “core” inflation as their measure of choice while we commoners who shop everyday for essentials know better. Turbo Tim even had the nerve to say the other day high gas prices are something we’ll just “adjust to” and “won’t hurt” the recovery. He has a government car and driver. He also had the nerve to reiterate the necessity to maintain a strong dollar. Yikes!
As you can see from the chart above, the Dollar is down 20% in 12 months with half of that decline coming in the first 4 months of 2011 as the Fed's policies continue to kick our currency while it's down. So what then, does that say about both corporate earnings - which are barely improved from last year or our National GDP, which was $14,446.4Bn in Q1 of last year. In order for GDP to keep up with the decline in the dollar - we will need to see at least $17.335Tn for Q1 2011 and I'm kind of doubting we are even up to $15Tn actually.
Do you want to measure GDP in real stuff? No you do not because it's ridiculously depressing but I'll do it because it's my job so, like a doctor who has to rip off a band-aid, I will now painfully point out the reality of our situation. Last April, $14.5Tn bought us 181.25Bn barrels of oil at $80 a barrel, this year, it buys us 128.88Bn (down 28.9%). Wholesale gasoline was $2.40 last April so our GDP was good for 6.041Tn gallons. At $3.37 yesterday, we're down to just 4.302Tn gallons - 28.7% less. Gold was $1,150 and our GDP bought us 12.6Bn ounces but this year we will disappoint a lot of rappers with just 9.5Bn ounces at $1,526, 24.6% less teeth to cap. Are we starting to see a trend here?
- Copper was $3.25 a pound and we had 4.46Tn of them last year, now it's 3.41Tn pounds at $4.25 a pound (down 23.5%)
- Silver was $18 an ounce last April and our GDP was good for 805.5Bn ounces. At $47.80, that's dropped to 303.3Bn ounces (down 62% - ouch!) - I guess we'd better ignore that one, right?
- Corn was $3.60 a bushel and that gave us 4.027Tn of them last year. This year, many will go hungry as our GDP now buys just 2.636Tn bushels at $5.50 (down 34.5%)
- Wheat came in at $500 a ton last year for 29Bn tons worth in our GDP but this year, not so much at $750 and just 19.3 tons (down 33%)
- Rice has held steady at $12 and that's pretty much the only thing staving off global starvation at the moment so, yay, I guess.
So thank goodness for the weak dollar or consumers in this country would probably be getting downright depressed as our real economic numbers and real corporate earnings fall off a cliff. That's why the Russell 2000 index is at an all-time high, punching past it's July 2009 bubble top at 855 yesterday as our small-cap companies exist almost entirely in the weak-Dollar bubble. Hopefully, Uncle Ben and Timmy can keep the dollar at all-time lows so we don't get a repeat of that nasty little incident in 2008 when we had a flight to the Dollar that sent it back from 71.31 in July of 2008 up to 88.46 in November (up 24%), which caused the Russell to drop all the way to 371 (down 56%).
Now the Dollar is back to 73 and the Russell is back to that 855 range and we are throwing a party as if we have accomplished something other than setting the economy up for another multi-trillion dollar value shock. Based on the declining buying power of our dollars, if your stock is not up about 30% from last April, you are losing ground to inflation! One way we try to keep our heads above water is through our inflation hedges and I listed on on USO and one on GLD on Monday, both with short-term 400% return potential and if you take one of those (which I don't believe in fundamentally) to hedge against our 500-1,000% disaster hedges - you can be in pretty good shape whichever way things turn out.
As we are still, like Dave Fry's group, bullish in our long-term positions, we keep pecking away at bearish day trades, hoping to be in the right place, when it is finally the right time. Yesterday we caught a nice break with a 60% gain on our QQQ puts from the Morning Alert but all that really does is make up for 3 20% losers and, clearly, most days have been up and up.
The important thing is to have some hedges in place because the conventional wisdom that "you can't fight the Fed" has proven true for 2 years now and it's very clear from Bernanke's speech last night that he's willing to drop our buying power another 30% in the coming year - if that's what it takes, to make his Banker buddies happy. Here's a technical look at our major indexes priced in Euros to compensate for the rapidly declining dollar:
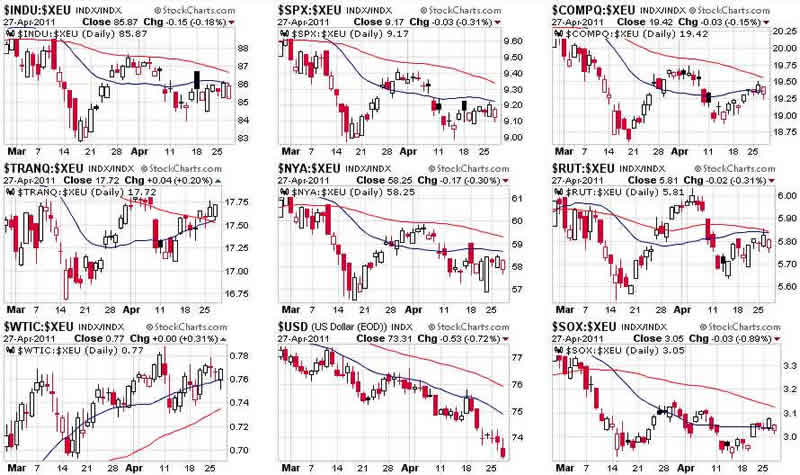
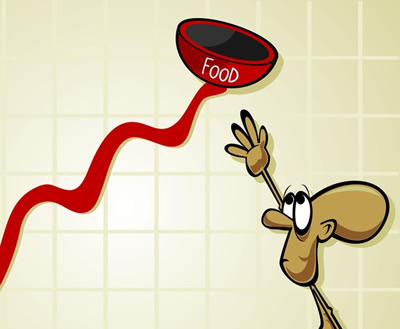
Note that the Transports and the Russell are making a "death cross" - where the 200 dma falls below the 50 dma and, other than oil - all of our indices are in a firm downward channel to the Euro (the same would apply to the Yen, the Pound or any other real currency). What the American technical traders are looking at is nothing more than a magic trick, an illusion to distract the rubes in this country who are trained from birth to buy into hype - and the Banksters live for the hype, don't they? Here's how dropping your buying power by 33% makes it look like your stocks are up 33%:
 Of course one Bankster's happiness is another person's misery and we are exporting a World of misery as the Shanghai Stock Exchange dropped 1.3% this morning and the Hang Seng fell 0.4% on a harsh 300-point (1.4%) rejection off the 24,000 line. China's B shares are down for the 5th consecutive session, hitting a 5-month low on speculation that the Government will impose a capital gains tax to reign in speculation. “There are lots of rumors about B shares such as a capital gain tax and yuan appreciation and all these things are weighing on the market,” said Wu Kan, a Shanghai-based fund manager at Dazhong Insurance Co., which oversees $285 million. “It’s an opaque market dominated by retail investors, who tend to believe market rumors and then sell in panic.” Shanghai’s B-share gauge is valued at 18 times reported earnings, compared with the multiple of 16.5 times for the A- share gauge, according to data compiled by Bloomberg.
The misery train moves on to India, where Mumbai home sales drop to a 2-year low as a combination of record prices and rising rates have rapidly shut down the real estate market. The World Bank is already warning that, in China: "Shocks to the property sector that would slow down construction significantly could have a large impact on the economy and on bank balance sheets,” the Washington-based lender said in its China Quarterly Update released in Beijing today. “A property downturn could affect the finances of local governments which do a lot of the infrastructure investment." In India, like China, food inflation is out of control - hitting new 3-week highs on yesterday's 2% drop in the Dollar, which The Bernank claims has nothing to do with inflation.
Rising food prices (and, don't forget it was rice that tipped us over the edge in 2008 - quiet at the moment) force the Reserve Bank of India and other emerging markets to hike rates to strengthen their currency and INCREASE the buying power of their people. Already rates are 8.08%, up 2% after 8 0.25 hikes since last March but still not keeping pace with 8.98% inflation.
This is how the Fed can appear to do nothing and blame other countries for inflation. We cause initial inflation with our zero-rate policies, other countries defensively raise rates, the Dollar drops further against those currencies, once again pushing inflation along as most commodities trade in Dollars and that forces governments to buy Dollars (our debt) and keeps our rates low while they have to tighten further and end up dropping the value of our Dollar (and the notes they are forced to keep buying) ever downward.
This can go on until the average US consumer reaches the income equivalence of the average Indian or Chinese consumer and, so far, the sheeple are putting up with it while we make day trades that return 60 and 75% - it's a great system from the top down - not so much from the bottom...
There's another way this can end. If the rest of the World gets fed up with the Fed's BS policies and refuses to play Bernanke's game anymore. That was the premise of our short position yesterday as my feeling is that EITHER Bernanke would apply a little bit of brakes and give some relief to the rest of the G20 by strengthening the Dollar (this did not happen at all) or the rest of the G20 will begin to work together to counter the US's weak-dollar interests, since they are contrary to the interests of the rest of the World other than the not-too-abstract case of the US being "too big to fail".
Well, maybe not all that big, with just a 1.8% rise in GDP, just over half of last Quarter’s growth pace and a far cry from keeping up with the 20-30% decline in our buying power but it’s "in-line" with low expectations. Spending rose 2.7% overall, driven by a 3.8% pace of "official" inflation, which offsets the rise in food and energy with the 6% decline in home prices and the fact that a new IPhone has two cameras for the same price as you used to get one camera so, therefore, you are getting more for your money when you buy an IPhone for the same price (see Penn and Teller video again if this logic confuses you).
A big decline in federal government spending also weighed on the economy. Federal spending fell 7.9%, the biggest drop in more than a decade, compared to a 0.3% decline at the end of 2010. National defense spending fell by 11.7% in January through March. State and local government spending also contracted. The housing sector resumed its decline, falling by 4.1% in the first three months of the year. Real final sales, which is GDP minus the change in private inventories, rose by 0.8% in the first quarter, down from a 6.7% rise in the fourth.
Even the Fed's beloved PCE, the most BS of all inflation measures, was up 275% from the previous quarter, from 0.4% to 1.5%. The overall PCE index is up 123% from 1.7% to 3.8% with the Fed predicting 2.1% to 2.8% in it's forecast.
Meanwhile, 429,000 Americans got pink slips last week, up 25,000 from the week before and 10% more than the 390,000 job losses expected. Is this news so bad it's going to be good? That's been the pattern lately when the worse the data sounds, the more likely it will be that Bernanke will keep the free money spigots flowing. Currently, we have 7.26M less people working than we did in January of 2008 with 3.6M of them drawing continuing unemployment claims and the rest of them just screwed.
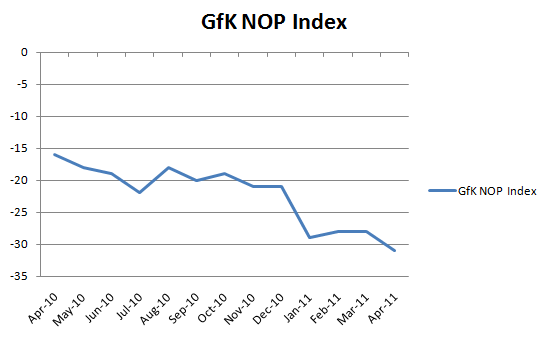 Believe it or not, my principal concern for the markets remains the Dollar, which is not dead yet - despite all appearances to the contrary. The Dollar is still the go-to currency in a global panic and ignoring Japan's ongoing nuclear catastrophe and the economic melt-down in Greece, where the government has to promise to return 148% to borrow money for 2 years - now we have UK Consumer Confidence falling to the lowest level since the March '09 crash.
How many warning signs (the same ones we saw in 2008) can we ignore as we push the markets ever higher on a sea of weak Dollars? I was talking to Ilene (our editor) last night about how things get ignored until the last minute and I came up with this example:
Let's say you are on an island with 10,000 people and 1M fish and all of the people need to eat 1 fish a week to live. That means you have a 100 week supply of fish right? But what if 1% of the people (100) eat 50 fish each per week each (5,000) but they live at the top of the island, on the other side of the pile of fish and the other 9,900 people only read about them in the paper and can't even fathom their 50 fish per week lifestyles?
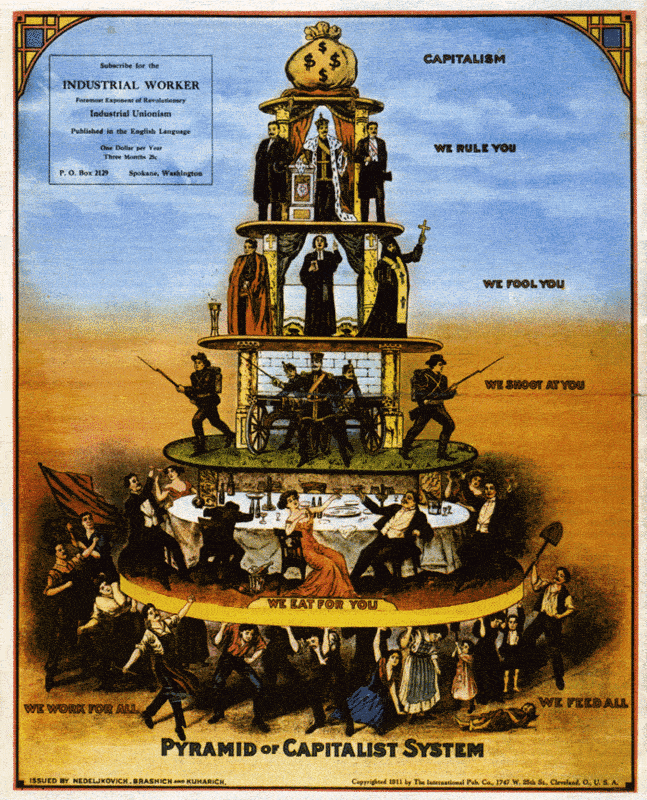
What happens after 6 months? Well the 9,900 people eat 257,400 fish and the 100 people eat 130,000 fish and there are still 612,600 fish left so the bottom 9,900 people go about their business and eat their 1 fish per week and the top 100 eat their 50 fish per week and everyone is happy. This can go on for another 6 months and then you have 225,000 fish left. At what point do the bottom 9,900 begin to be directly harmed by the actions of the top 100? Only at the point when there are less than 14,900 fish left because, at that point, the "needs" of the top 100 force some of the bottom 100 to starve.
That's what we're doing now. The top 1% of this country are doing quite well with our inflation hedges and our derivatives trading and our commodity speculation and we are sucking all of the capital out of the system while the bottom 99% get less and less every week. Where is the breaking point? Certainly none of us want to take less but, at some point, the huddled masses will rise up - this was my prediction in "A Tale of Two Economies" and we are right on track for the next American revolution but it's a slow train so grab those fish while you can, my friends - you may need them to barter with down the road!
To try Phil's Stock World, click here >
Phil
Philip R. Davis is a founder of Phil's Stock World (www.philstockworld.com), a stock and options trading site that teaches the art of options trading to newcomers and devises advanced strategies for expert traders. Mr. Davis is a serial entrepreneur, having founded software company Accu-Title, a real estate title insurance software solution, and is also the President of the Delphi Consulting Corp., an M&A consulting firm that helps large and small companies obtain funding and close deals. He was also the founder of Accu-Search, a property data corporation that was sold to DataTrace in 2004 and Personality Plus, a precursor to eHarmony.com. Phil was a former editor of a UMass/Amherst humor magazine and it shows in his writing -- which is filled with colorful commentary along with very specific ideas on stock option purchases (Phil rarely holds actual stocks). Visit: Phil's Stock World (www.philstockworld.com)
© 2011 Copyright PhilStockWorld - All Rights Reserved Disclaimer: The above is a matter of opinion provided for general information purposes only and is not intended as investment advice. Information and analysis above are derived from sources and utilising methods believed to be reliable, but we cannot accept responsibility for any losses you may incur as a result of this analysis. Individuals should consult with their personal financial advisors.
© 2005-2022 http://www.MarketOracle.co.uk - The Market Oracle is a FREE Daily Financial Markets Analysis & Forecasting online publication.


