U.S. Dollar’s Impact on the Stock Market, Gold, Silver, and Crude Oil
Stock-Markets / Financial Markets 2011 May 25, 2011 - 02:56 AM GMTBy: J_W_Jones

 In doing some brief reading around the blogosphere I have noticed that most pundits are writing off gold, silver, and oil entirely. In fact, I have even read that the selloff is just beginning in precious metals and energy. In addition to the bearish traders, it seems as though even more traders are expecting some period of consolidation. Lower prices and a period of consolidation make sense, but what I am more interested in at this stage is a clear setup that offers solid risk / reward.
In basic terms, I try to identify key price levels and then allow price action to generate signals about Mr. Market’s preferred direction, regardless of the underlying asset. Trading is an undertaking where operating with defined risk is paramount to both survival and success. Leveraging probability and focusing on trade/money management represent the other side of success. With that said, I am currently sitting in cash waiting for setups to emerge. The following analysis should be viewed as merely a context of price action and not a catalyst(s). Technical analysis is only one view of the marketplace and often times it proves to be contradictory to Mr. Market’s plans.
Currently I have differing views on various asset classes as it relates to risk and sensitivity to the U.S. Dollar. As of mid-morning on Monday, price action in the S&P 500 and oil was ugly as European debt issues still loomed large over global financial markets. The debt issues in the Eurozone were pushing prices of the U.S. Dollar Index higher while the Euro tested critical support. So far Tuesday we are seeing higher prices in risk assets, although the S&P 500 is lagging behind gold, silver, and oil.
For readers who have been reading my work in the recent past, I have not made any predictions but instead typically offered both sides of the price action and allowed individual investors and traders to come to their own conclusions. I generally do not trust financial writers or pundits who are always biased about price direction because often times I feel like they are pumping their book or hoping to get viewers or readers to follow them into their recommended positions.
At this time I do not have an open position in any of the underlying assets discussed in this article. No equity, futures, or option positions are open at this time and members of my service at OptionsTradingSignals.com have come to realize that when the market gets choppy, I like to remain in cash and wait for solid setups. Right now the S&P 500 looks like it could go either direction, but the day/week is far from over and Tuesday’s closing bell has not been heard. The following analysis is my current view of the marketplace.
S&P 500
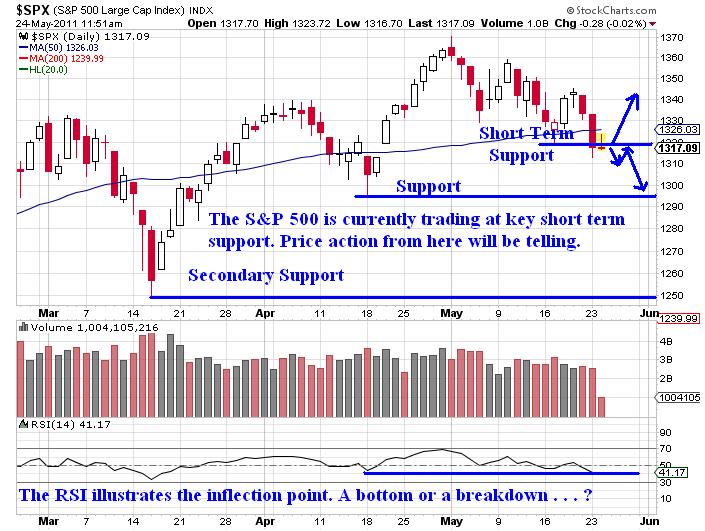
The S&P 500 (SPX) is trading slightly higher today (Tuesday) as it retraces the big move lower we saw on Monday. Currently the SPX is trading right at a key support level. Solid volume accompanied lower prices yesterday as represented by the S&P 500 E-Mini futures contracts as well as the SPY ETF. I am going to be watching price action closely the next few days to see how the S&P 500 index handles the current support level. Right now the SPX looks poised to break down, but a bounce later today could push the index back above the key support level and an extension higher could be seen making a potential reversal more likely. The close on Tuesday and Wednesday should provide traders with clues about where the S&P 500 is headed. The daily chart of SPX shown below illustrates the key support levels in the short term:
U.S. Dollar Index
The U.S. Dollar Index pushed above recent highs on Monday but is experiencing selling pressure today. The selling pressure is being largely dismissed by the S&P 500 but other risk assets such as gold, silver, and oil are benefitting. Members of my service at OptionsTradingSignals.com understand that I have been focusing on the U.S. Dollar for weeks. Right now risk assets are trading primarily in the opposite direction of the Dollar. Obviously there are exceptions to the rule, but a strong Dollar has meant lower equity and oil prices specifically. Gold and silver have been holding up well as fearful investors are using gold and silver as safe havens against the potential for a European debt default or a Euro currency crisis.
The U.S. Dollar may have put in a key pivot low on the daily chart back in the early part of May. In addition, the key 200 period moving average is overhead and the U.S. Dollar may be poised to test the key price level in the future. The daily chart of the U.S. Dollar can be seen below:
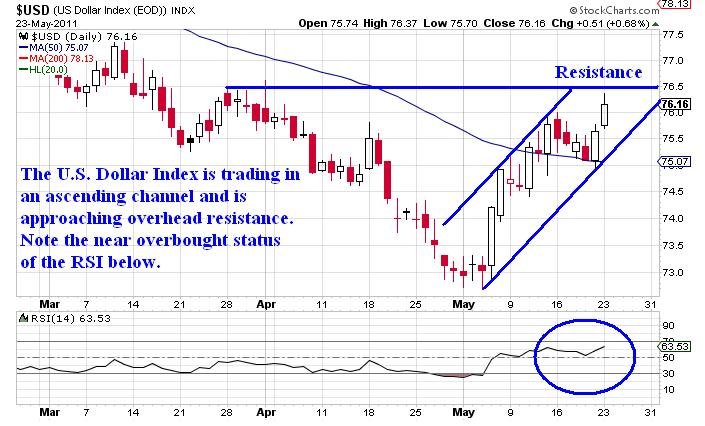
While the Dollar could roll over and probe lower, the fact that it has put in a higher low and broken out above recent highs is bullish. Similar to the S&P 500, the next few daily closes are going to be critical as it relates to risk assets. I will be monitoring the U.S. Dollar’s price action quite closely as a clue where equities may be headed.
Gold
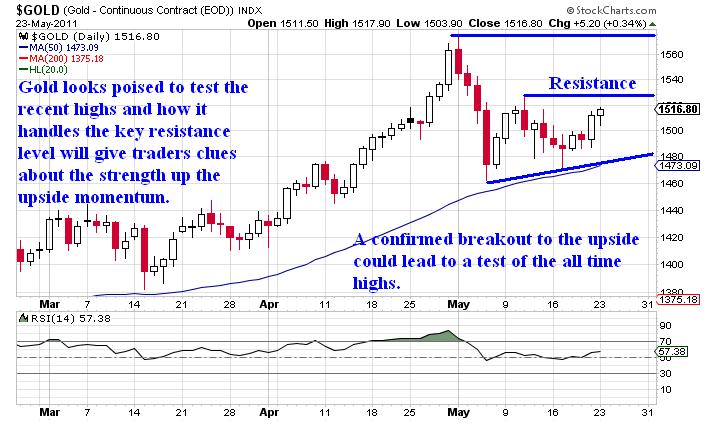
Gold futures closed the day above the 20 period moving average on Monday and are extending gains today. Gold did not sell off to the same degree as silver and so far the 50 period moving average on the daily chart has offered key support. I would not be surprised to see the rally in gold continue in coming days and weeks as the situation in Europe will likely be in the forefront of headlines in the near term.
It is possible for gold futures to push higher and possibly attack and test the recent highs. If we do get a strong extension higher in gold I would expect a blow-off top and a subsequent selloff that is quite deliberate and nasty. I think in the short term we could see gold put in new highs and possibly climb above the key $1,600 an ounce price level. However, if we do get a strong extension higher I will expect to see sellers beginning to step in if price gets above the $1,600 price level. The daily chart of gold futures is shown below:
Light Sweet Crude Oil
Analysts from Goldman Sachs are declaring that oil prices will likely increase in the near to intermediate term. Price action so far on Tuesday has just about totally negated the nasty red candle from Monday. Oil continues to consolidate near the lows and will eventually either breakdown to new lows and possibly test the 200 period moving average or we will see an extension higher to the $103 – $105 / barrel price level. The daily chart of oil futures is shown below:
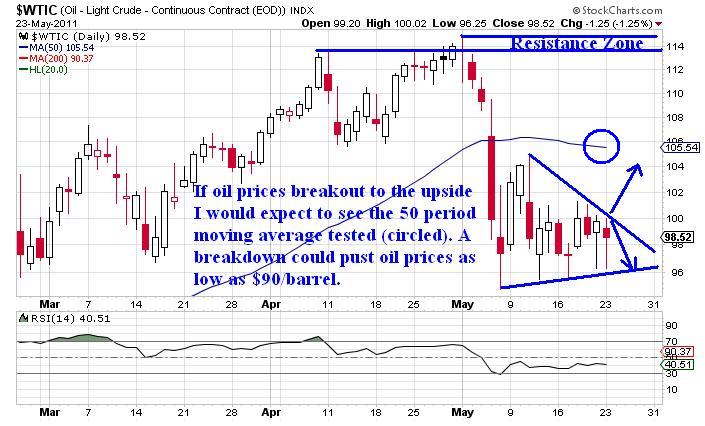
In the longer term, I remain extremely bullish of energy as the fundamentals indicate that oil demand will likely continue to rise while supply levels remain flat or begin to increase. Oil prices are likely to go much higher than what most analysts are expecting. For now, I’m going to be watching the key support level illustrated above. If oil prices continue to consolidate at these levels a breakout is nearly inevitable. The question remains which way will oil break?
Silver Futures
Silver futures are rallying hard on the weak price action in the U.S. Dollar. Silver is currently trading +3.50% intraday and is on target to test the .236 Fibonacci Retracement level. Silver looks relatively strong here and if prices continue to work higher I would expect to see prices of silver reach as high as $41.25 before sellers take back control. The daily chart of silver futures is shown below:
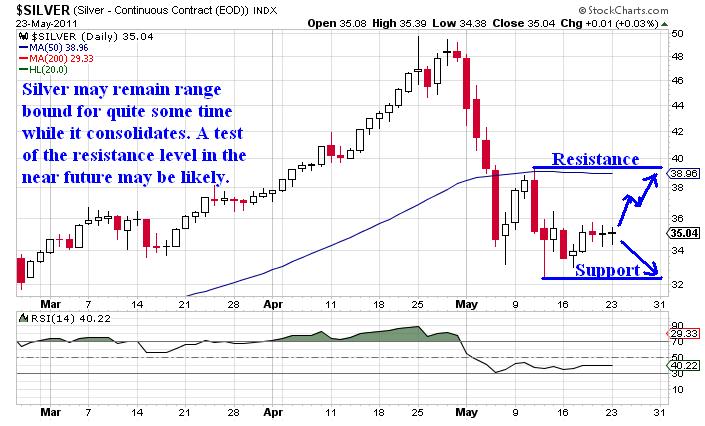
The consolidation that I am seeing in silver reminds me that the underlying demand for silver is still there. If the Dollar continues to weaken or more money pours into silver as a safety hedge away from the Euro currency, we could see silver put on a strong run higher before ultimately selling off again. Silver futures trade with increased volatility during specific periods of time. I am going to continue to monitor the price action in the U.S. Dollar, Gold, and silver.
Conclusion
I continue to watch price action waiting for a solid setup to form before getting involved. I realize that precious metals and oil are higher today, but both are the products of a weaker U.S. Dollar. It remains to be seen whether we continue to see stocks selloff. In terms of the price action in the S&P 500, I continue to wait to see if we get a clear cut setup. What I do know is taking an anticipatory trade on the S&P 500 is a great way to lose money. I hate losing money, so I will remain in cash in the short run and let price action dictate my next trade.
In my opinion we are sitting at a key inflection point that is going to tell us a great deal about the tenor of the marketplace. When we get a failed break or a key breakout it should provide traders with clues about Mr. Market’s intentions. Until then we will have to sit back and wait patiently for prudent setups to transpire.
If you would like to be informed several times per week on SP 500, Volatility Index, Gold, and Silver intermediate direction and options trade alerts… take a look at http://www.optionstradingsignals.com/specials/index.php today for a 24 hour 66% off coupon, and/or sign up for our occasional free updates.
J.W. Jones is an independent options trader using multiple forms of analysis to guide his option trading strategies. Jones has an extensive background in portfolio analysis and analytics as well as risk analysis. J.W. strives to reach traders that are missing opportunities trading options and commits to writing content which is not only educational, but entertaining as well. Regular readers will develop the knowledge and skills to trade options competently over time. Jones focuses on writing spreads in situations where risk is clearly defined and high potential returns can be realized.
This article is intended solely for information purposes. The opinions are those of the author only. Please conduct further research and consult your financial advisor before making any investment/trading decision. No responsibility can be accepted for losses that may result as a consequence of trading on the basis of this analysis.
© 2005-2022 http://www.MarketOracle.co.uk - The Market Oracle is a FREE Daily Financial Markets Analysis & Forecasting online publication.


