


Stock Market and Gold in the Land of Chop
Stock-Markets / Financial Markets 2011 May 30, 2011 - 04:30 AM GMT

 The markets went nowhere in a pretty flat week, they closed virtually where they opened, so no real clarity on the market direction, although we were working a few ideas going into last week, we think we are getting closer to a potential pattern or 2 patterns that should lead the way higher and see more upside from here.
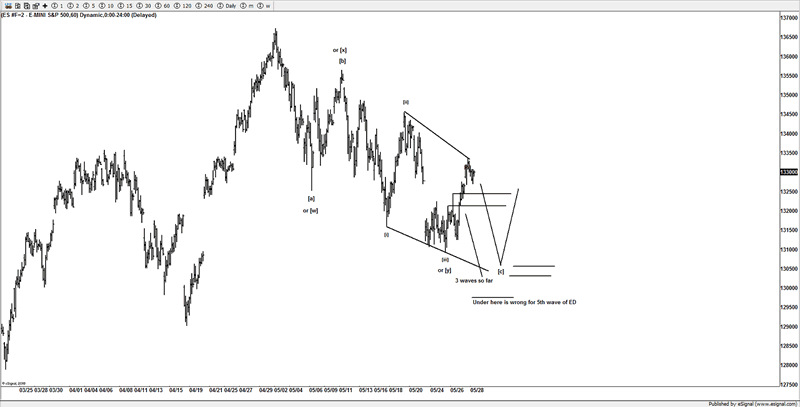
Earlier in the week, I have been focusing on the 1306ES are on the ES contract, and we actually saw that hit in the globex session, but there is a potential to see that area again with a new move lower, although we have to respect the fact the market may have indeed put in a low.
In last week's article, you will note that I had been focusing on an area of fibbo support from 1310SPX to 1295SPX the market, almost made it to that area.
Fridays move, never really conclusively confirmed that a low was in place, as it held just under the 1332SPX resistance are and a down trending trend line, so it's all about globex over the coming hours, we have a key area that we confirm or negate this pattern, or at least help us stay on the right side of these markets, as we have seen some nasty swings of late, which I am sure are hurting traders.
One idea is that the low is not in place and we need to see that 1306ES area, over the years I have noticed the cash session likes to visit any areas seen in the globex session, so this idea whilst a little stronger than I would have liked on the upside, is still a setup that can see lower prices early next week. We initially were looking for a 1327ES if this was to be a 4th wave of a ED.
In order for this idea to become viable, globex will need some weakness early on Monday and stay under our key areas to help strengthen this idea.
The alternative is that last week actually put in a low and we are working one of a couple larger ideas, but it really comes down to any weakness in the globex session over the coming days.
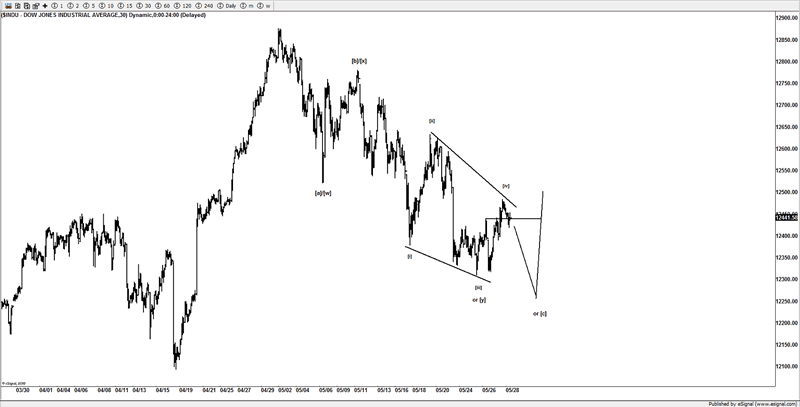
One of the reasons, that this setup could be seen, is although it looks a little stronger on the NDX and SPX, the DOW don't really support a stronger bounce from the lows seen last week, and the general look still seems to be wedging on all 3 major markets, if you look at the bounce in the DOW, it seems more like a 3 wave bounce as opposed to something that could be the start of something to stretch higher
Although in order to suggest a new low, we need to see a move under key supports area to embrace the idea, if not the low is likely in and higher prices likely.
The Bearish idea not shown here is that of a series of 1s and 2s, but I tend to think that's getting stretched as unless you see a very aggressive move lower, the evidence atm is lacking in conviction that an aggressive move lower is indeed setting up, although we will be monitor price action and trade accordingly, as the ideas shown here, are just ideas, as the market moves we will move with it.
If the low is in, another idea is that the markets could be in the 5th wave of an ED, as its clearly wedging higher, with a target towards 1390, this idea can still be possible if a new low is seen next week under last week's low, with a new high there would be enough gyrations to label it as a completed pattern, and thus end the rally from March 2008 as a larger ABC correction.
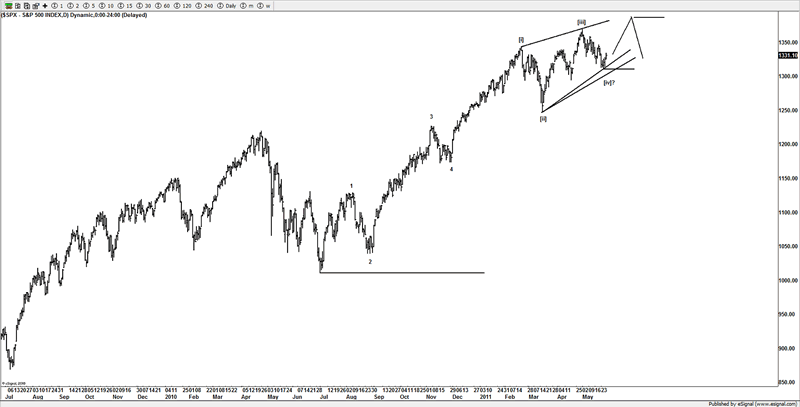
Overall the markets can still potentially see a new low towards 1306ES, but if we see strength on the markets early next week, the potential for a 5th wave for the ending diagonal idea is also an idea we are watching, the key to the pattern will be if it wedges, there is still the potential for the other ideas I showed in last week's report, as this week was flat, so offered no real edge. The key to the ED idea is if price starts chopping higher and continues to wedge, that's an important key feature.
Most traders are aware of the US$ influence on the markets, and its also something that needs to be watched, as we see weakness in some markets like silver and oil but some strength in stocks, so not as clear as we had hoped, early next week should hopefully clear a trend and help define one of the working patterns.
Gold
The potential for gold to see a new high is something that might be being suggested from the current sideways chop, currently with 3 waves, this has the potential for either a ZZ, flat or triangle (as shown) but the Bulls still own this market, as until this is below $1440, the 4th wave option, so we are closely watching for a some trading opportunities next week
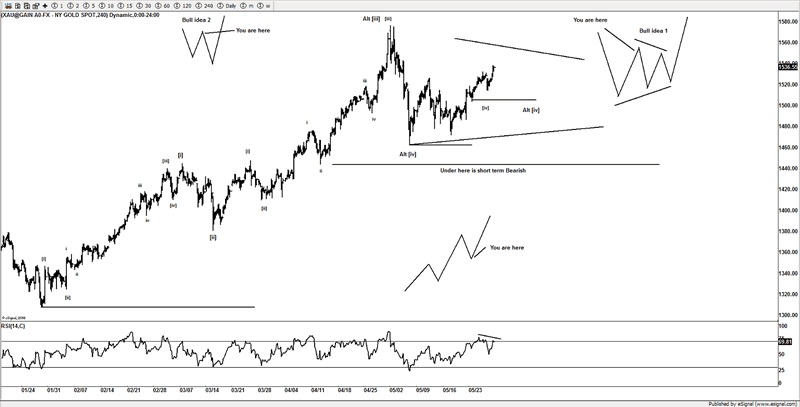
There is Bearish alternative to gold if we were to see price push under $1440 but until it does, we tend to favor more upside from here, but suspect still in an on-going 4th wave.
Until next time.
Have a profitable week ahead.
Click here to become a member
You can also follow us on twitter
What do we offer?
Short and long term analysis on US and European markets, various major FX pairs, commodities from Gold and silver to markets like natural gas.
Daily analysis on where I think the market is going with key support and resistance areas, we move and adjust as the market adjusts.
A chat room where members can discuss ideas with me or other members.
Members get to know who is moving the markets in the S&P pits*
*I have permission to post comments from the audio I hear from the S&P pits.
If you looking for quality analysis from someone that actually looks at multiple charts and works hard at providing members information to stay on the right side of the trends and making $$$, why not give the site a trial.
If any of the readers want to see this article in a PDF format.
Please send an e-mail to Enquires@wavepatterntraders.com
Please put in the header PDF, or make it known that you want to be added to the mailing list for any future articles.
Or if you have any questions about becoming a member, please use the email address above.
If you like what you see, or want to see more of my work, then please sign up for the 4 week trial.
This article is just a small portion of the markets I follow.
I cover many markets, from FX to US equities, right the way through to commodities.
If I have the data I am more than willing to offer requests to members.
Currently new members can sign up for a 4 week free trial to test drive the site, and see if my work can help in your trading and if it meets your requirements.
If you don't like what you see, then drop me an email within the 1st 4 weeks from when you join, and ask for a no questions refund.
You simply have nothing to lose.
By Jason Soni AKA Nouf
© 2011 Copyright Jason Soni AKA Nouf - All Rights Reserved
Disclaimer: The above is a matter of opinion provided for general information purposes only and is not intended as investment advice. Information and analysis above are derived from sources and utilising methods believed to be reliable, but we cannot accept responsibility for any losses you may incur as a result of this analysis. Individuals should consult with their personal financial advisors.
© 2005-2022 http://www.MarketOracle.co.uk - The Market Oracle is a FREE Daily Financial Markets Analysis & Forecasting online publication.