Watching Silver and S&P Stocks Index
Stock-Markets / Financial Markets 2011 Aug 13, 2011 - 06:50 AM GMTBy: Mike_Paulenoff
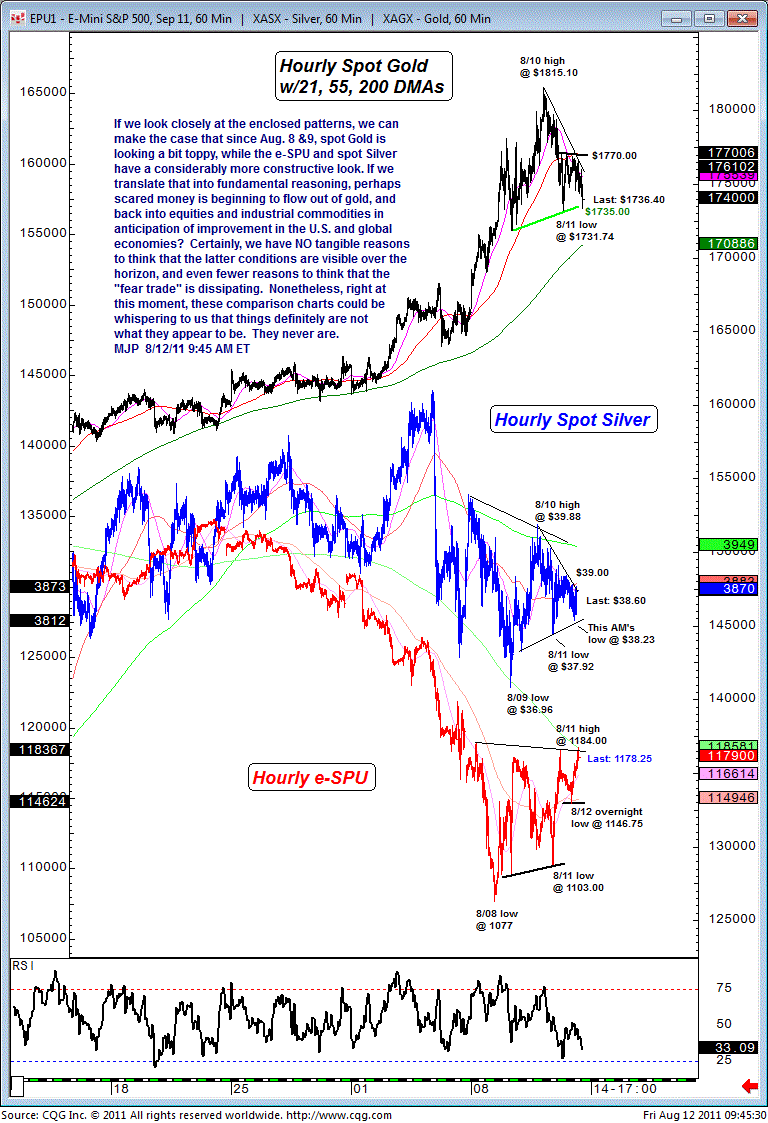
If we look closely at the enclosed patterns, we can make the case that since Aug 8 & 9, spot gold is looking a bit toppy, while the emini S&P 500 and spot silver have a considerably more constructive look.
If we translate that into fundamental reason, perhaps scared money is beginning to flow out of gold and back into equities and industrial commodities in anticipation of improvement in the U.S. and global economies.
Certainly, we have no tangible reasons to think that the latter conditions are visible over the horizon, and even fewer reasons to think that the "fear trade" is dissipating.
Nonetheless, right at this moment, these comparison charts could be whispering to us that things definitely are not what they appear to be -- which ETF traders of the SPDR Gold Shares (GLD), iShares Silver Trust (SLV), and S&P 500 Depository Receipts (SPY) may want to heed.

Sign up for a free 15-day trial to Mike's ETF & Stock Trading Diary today.
By Mike Paulenoff
Mike Paulenoff is author of MPTrader.com (www.mptrader.com), a real-time diary of his technical analysis and trading alerts on ETFs covering metals, energy, equity indices, currencies, Treasuries, and specific industries and international regions.
© 2002-2011 MPTrader.com, an AdviceTrade publication. All rights reserved. Any publication, distribution, retransmission or reproduction of information or data contained on this Web site without written consent from MPTrader is prohibited. See our disclaimer.
Mike Paulenoff Archive |
© 2005-2022 http://www.MarketOracle.co.uk - The Market Oracle is a FREE Daily Financial Markets Analysis & Forecasting online publication.
Comments
|
TBB
13 Aug 11, 16:42 |
Head and Shoulders top
Mike, great illustration of what looks like a head and shoulders top in gold on the hourly chart. Looks like $1650 is in the cards. Do you agree? Thanks! |


