


EURO Volatility and S&P Risk
Stock-Markets / Financial Markets 2011 Sep 07, 2011 - 06:38 AM GMTBy: Capital3X

 EUR/USD correction from 1.4550 on 29 Aug 2011 has now extended to 1.3960 levels on 6 September 2011, correction of 600 pips. We did forecast for such a move given the weakening fundamentals in EU zone and the pickup in volatility. Refer our EURO volatility charts
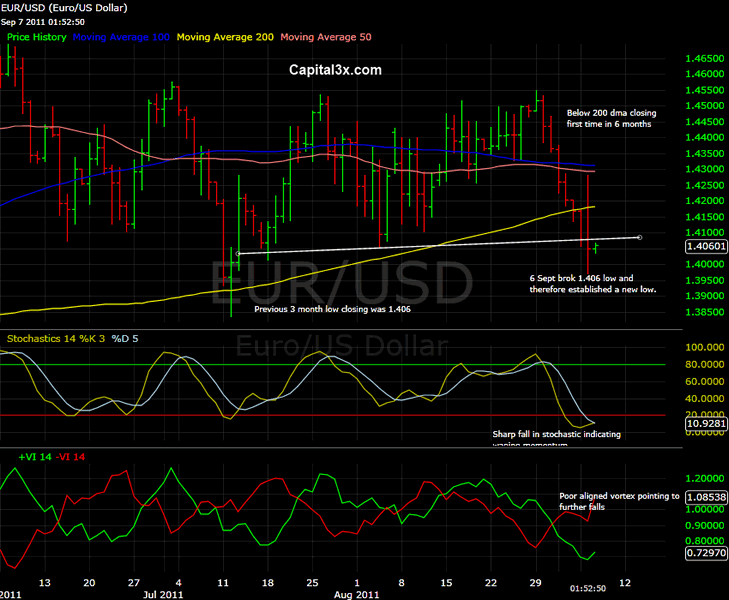
EUR/USD has quite clearly broken all forms for supports on its way down as it has knifed through 50 dma, 100 dma and 200 dma. It has closed below 200 dma for the first time in 6 months.
The stochastic has now closed below 20 levels pointing to some severe falls to come. The vortex indicator is widening the negative crossover as a strong bearish trend is about to grip the EUR/USD pair unless further updates released.
An updated Volatility Charts
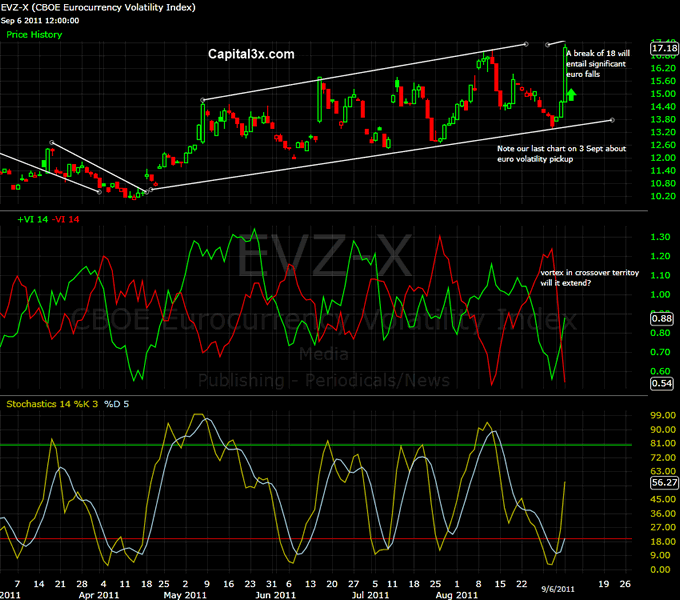
Many of our subscribers may have had a head start into the week as the euro has been falling all last week and this week. This was the premium piece of analysis which predicted the fall. EURO volatility predicting the next wave of euro downturn
The volatility in the EURO currency has now reached critical and dangerous levels of 17-17.3. A break above the trend line at 18 will clearly be hazardous for EURO pairs across and thus pushing for a eur/usd towards key 1.37-.375 levels. The stochastic of the volatility charts are also pointing upwards at 56 and vortex is arguing for an extension of the strong wave of volatility. The EURO volatility charts jumped from 14.8 to 17 in one day marking the biggest jump in 24 months.
A quick look at S&P risk and volatility should also serve us well to understand risk tendencies.
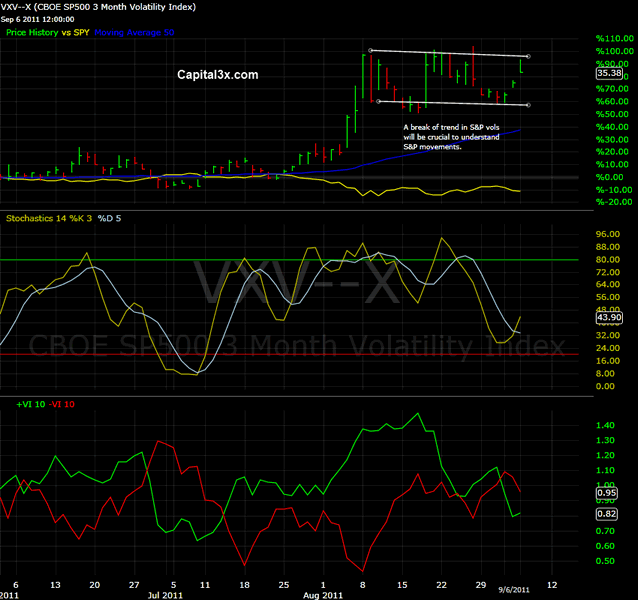
S&P 3 month vols have now reach the upper range of the range seen over the last 60 days. A break above is only pointing to serious build up of fear and unease, the smell of which is enough to attract the bears who have already have had meal over the last 60 days.
Charts from treasury market are pointing unprecedented yields on 10 Year benchmarks treasury bonds, a sign of extreme unease and uncertainty.
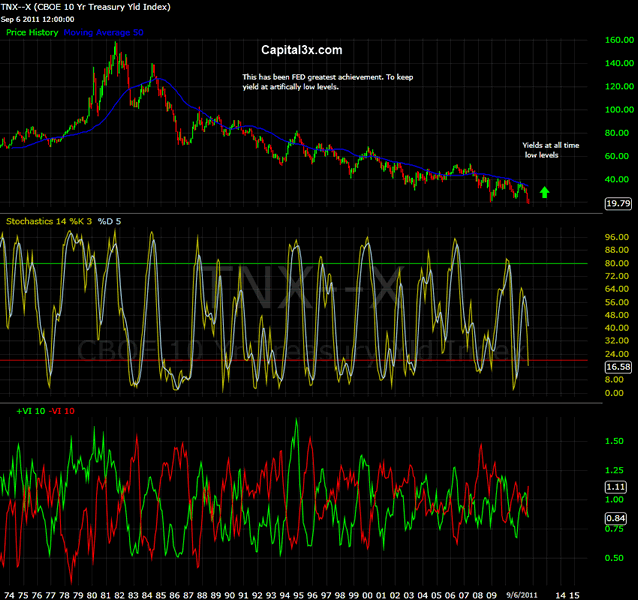
The yields have never close below 2.0% before this.
Looking at the 6 months charts for the treasury 10 year bonds:
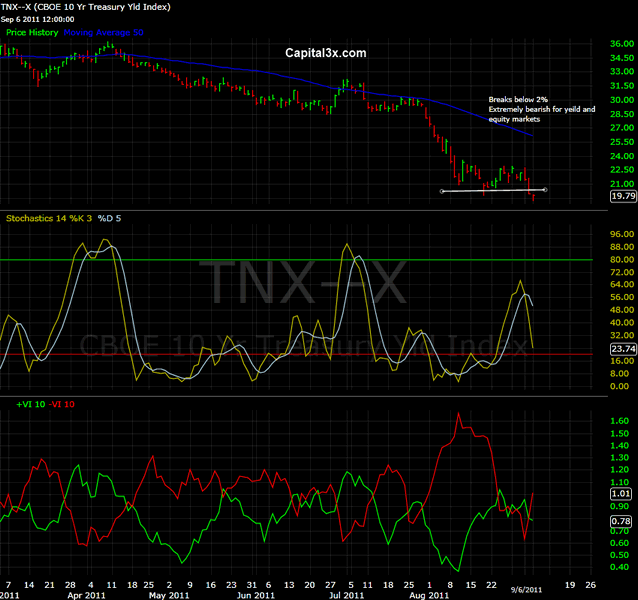
Stochastic are pointing to no comfort for the treasury bears as treasuries are expected to fall further. The vortex indicator points to no signs of any kind of trend reversals.
While we are not charting the 1M and 3M notes, the yields are at record lows at 0.02%.
Unfortunately there is very little comfort for any bulls who may have escaped the bear carnage over the last few weeks. The bears are roaming hungry and there is very little one can do other than book losses and hided behind the treasuries.
This is all part of the premium analysis for 7 Sept 2011. The premium section also carries trading portfolio of Capital3x.
Our feeds: RSS feed
Our Twitter: Follow Us
Kate
Capital3x.com
Kate, trading experience with PIMCO, now manage capital3x.com. Check performance before you subscribe.
© 2011 Copyright Capital3X - All Rights Reserved
Disclaimer: The above is a matter of opinion provided for general information purposes only and is not intended as investment advice. Information and analysis above are derived from sources and utilising methods believed to be reliable, but we cannot accept responsibility for any losses you may incur as a result of this analysis. Individuals should consult with their personal financial advisors.
© 2005-2022 http://www.MarketOracle.co.uk - The Market Oracle is a FREE Daily Financial Markets Analysis & Forecasting online publication.