


Ominous Signals for Silver and Stocks
Stock-Markets / Financial Markets 2011 Oct 22, 2011 - 01:11 AM GMTBy: Chris_Ciovacco

 On October 20, we outlined several divergences and hurdles for the stock market to overcome. Since silver has more real world uses than gold, silver tends to be a good economic barometer, similar to copper. As we have mentioned in the past, silver tends to be in greater demand when (a) the economy is expected to grow, and (b) when inflation expectations are high.
According to the Silver Institute:
Silver has a number of unique properties including its strength, malleability and ductility, its electrical and thermal conductivity, its sensitivity to and high reflectance of light and the ability to endure extreme temperature ranges. Silver’s unique properties restrict its substitution in most applications.
When silver is weak it is logical to question (a) the expectations for future economic growth, and (b) if investors are concerned about future inflation. If inflation is not a concern, then deflation fears are most likely increasing. When silver is weak, it is not a good sign for the economy or stock market.
Bearish divergences occur on charts when silver (SLV) makes a higher low (see green line at the bottom of the chart), but the indicator makes a lower low (red line). The divergence indicates an increasing negative bias by investors. In 2008, silver made a higher low accompanied by a bearish divergence in MACD (top). The blue line in the chart below is the 22-week moving average. Healthy markets tend to stay above the 22-week. The 22-week also tends to have a positive slope in a healthy market. Notice when (a) price was below the 22-week and (b) the slope of the 22-week rolled over below, silver prices tended to decline.
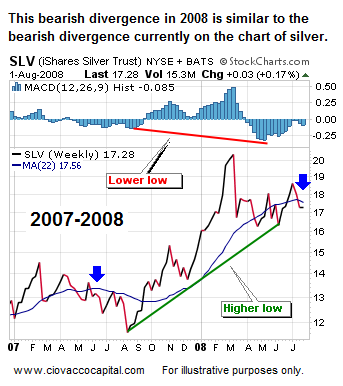
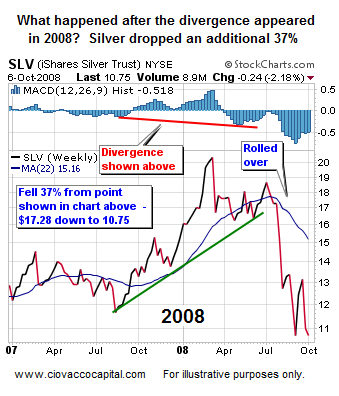
The bearish divergence in 2008 said “be ready for the strong possibility of lower lows in silver.” Divergences that appear on a weekly chart are much more meaningful than those appearing on a daily chart. Note the 22-week (blue line) also rolled over early in the bear market.
A similar and ominous bearish divergence in silver occurred between the summer 2010 lows and recent 2011 lows. This divergence may foreshadow more pain for stock and precious metals investors in the coming weeks and months. Bearish divergences on a weekly chart need to be respected, as they can be powerful signals. Do all bearish divergences lead to new lows? No, it is possible silver goes on to make higher highs, but it is a lower probability outcome, especially given the current fundamental and technical state of the financial markets. The blue arrow below denotes the recent negative turn in the 22-week, which tends to be associated with a weak market. Our recent review of the 2008 and 2011 daily charts of silver also lean in a bearish direction.
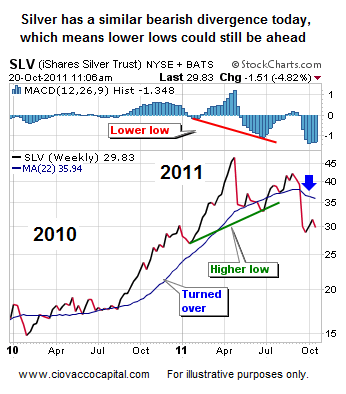
Is it possible silver has already made the lower low? Yes, but the indicator (see blue bars) also made a lower low, which tends to “confirm” the downtrend. Some type of bullish divergence would increase the odds of silver finding a bottom; something that has not occurred yet. It also appears to be early in the rollover cycle for the 22-week – it has a look associated with continued weakness. We are open to a rally in silver (and stocks) should conditions improve, but given what we know today, the bears seem to have an upper hand over the next few weeks and months. Silver’s weakness aligns well with deflationary outcomes, which favors bonds (TLT), the dollar (UUP), and shorts (SH) (see analysis).
-
Copyright (C) 2011 Ciovacco Capital Management, LLC All Rights Reserved.
Chris Ciovacco is the Chief Investment Officer for Ciovacco Capital Management, LLC. More on the web at www.ciovaccocapital.com
Ciovacco Capital Management, LLC is an independent money management firm based in Atlanta, Georgia. As a registered investment advisor, CCM helps individual investors, large & small; achieve improved investment results via independent research and globally diversified investment portfolios. Since we are a fee-based firm, our only objective is to help you protect and grow your assets. Our long-term, theme-oriented, buy-and-hold approach allows for portfolio rebalancing from time to time to adjust to new opportunities or changing market conditions. When looking at money managers in Atlanta, take a hard look at CCM.
All material presented herein is believed to be reliable but we cannot attest to its accuracy. Investment recommendations may change and readers are urged to check with their investment counselors and tax advisors before making any investment decisions. Opinions expressed in these reports may change without prior notice. This memorandum is based on information available to the public. No representation is made that it is accurate or complete. This memorandum is not an offer to buy or sell or a solicitation of an offer to buy or sell the securities mentioned. The investments discussed or recommended in this report may be unsuitable for investors depending on their specific investment objectives and financial position. Past performance is not necessarily a guide to future performance. The price or value of the investments to which this report relates, either directly or indirectly, may fall or rise against the interest of investors. All prices and yields contained in this report are subject to change without notice. This information is based on hypothetical assumptions and is intended for illustrative purposes only. THERE ARE NO WARRANTIES, EXPRESSED OR IMPLIED, AS TO ACCURACY, COMPLETENESS, OR RESULTS OBTAINED FROM ANY INFORMATION CONTAINED IN THIS ARTICLE. PAST PERFORMANCE DOES NOT GUARANTEE FUTURE RESULTS.
Chris Ciovacco Archive |
© 2005-2022 http://www.MarketOracle.co.uk - The Market Oracle is a FREE Daily Financial Markets Analysis & Forecasting online publication.