


Return of Fear for Stock and Financial Markets
Stock-Markets / Financial Markets 2011 Nov 03, 2011 - 06:22 AM GMTBy: Capital3X

 We said in Sept first week to be prepared for “Bloody September”, then we said in first week of October that be prepared for an October rally and now we update our analysis for November.
So if October was where the bears digested their food from September as they slept through bull run on October, we could see them coming back in November.
We begin the analysis by looking at DXY which for all practical purpose derive all its strength and patterns from the bond markets (UST and Bunds). Higher the bonds move, DXY responds in kind as it tracks bond strength.
DXY Daily charst
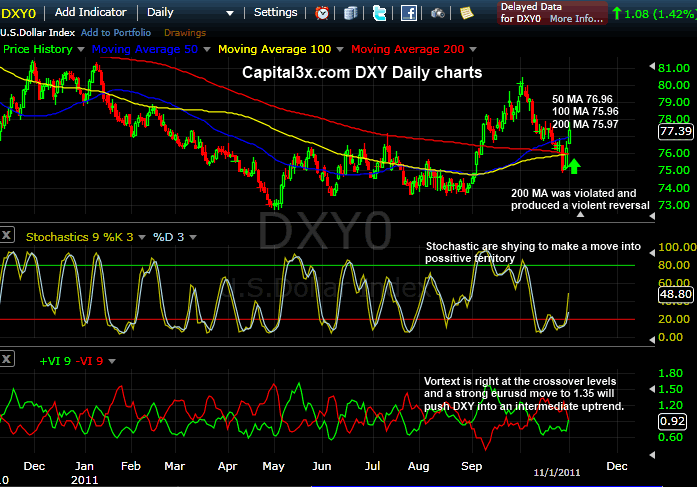
Charts are self explanatory but key points:
1. DXY broke below 200 MA after breaking out of it after 4 months of consolidation. The last time it broke out after such a long consolidation was in 2008.
2. DXY indicators are now pointing to fresh bullish strength as stochastic and vortex are indicating further upside.
3. Capped by 50 and 100 MA and supported by the 200 MA, DXY look set to launch out of the consolidation zone.
Bunds and UST daily charts
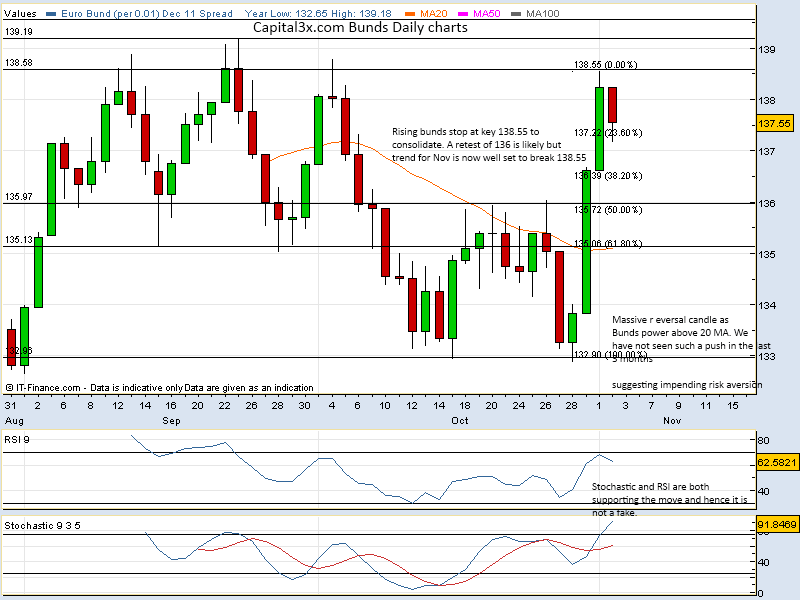
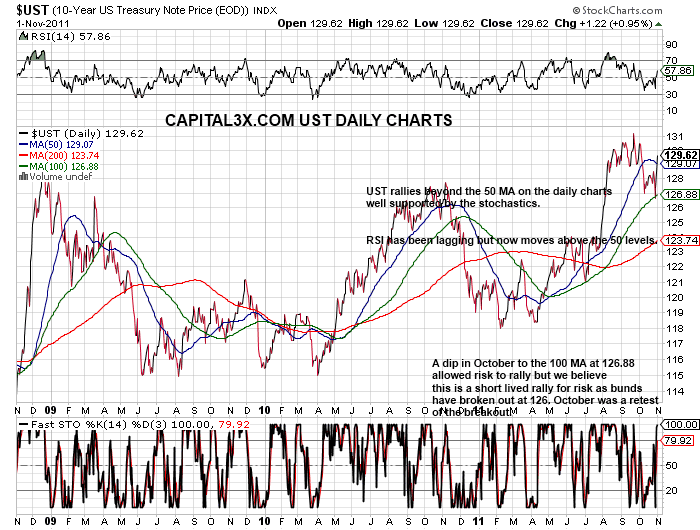
Both bunds and UST are indicating that fresh highs are on the anvil. Bunds have formed a massive reversal candle, the buying pressure of this magnitude was unseen over the last 2 months. They have stopped at the key level of 138.5 and are now consolidating. All major breakouts typically test the breakout level which in this case is 136.03. We expect bunds to test this level before moving higher on a series of strong candles.
Given the strong bias on bond markets for extended risk off rally, we expect the Dollar Index to power above all the cluster zones at 77.5/78.5 (50,100 ma and WMA). Once above these congestion levels, dollar index should easily move uncontested to the 80 levels.
Along with DXY, Bunds and UST, we now look at 3 key INTER MARKET PAIRS, which form the bed rock of risk analysis:
USDCHF Daily charts
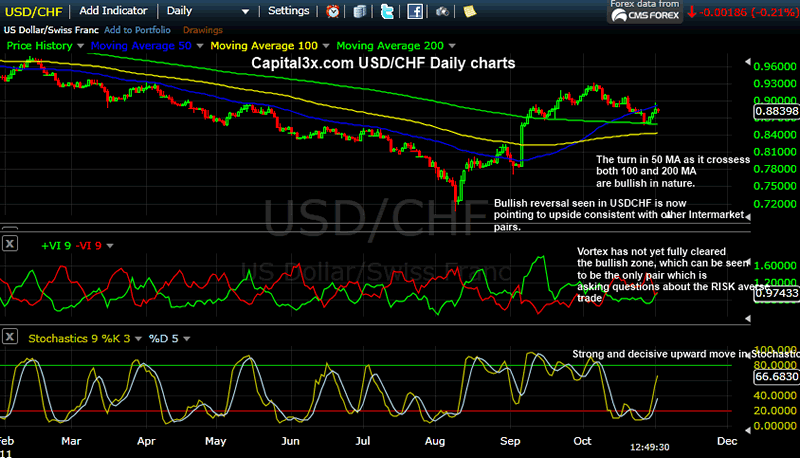
As DXY strengthens, the strength in part derived from weak eur, usdchf has started its long awaited reversal from the lows of 0.868. The vortex and stochastic are advocating strong gains. Any further escalation of eur crisis combined with the lack lustre data, USDCHF macro are in line with technical picture.
The second pair that provides key insights into Risk environment are:
USDCAD Daily charts
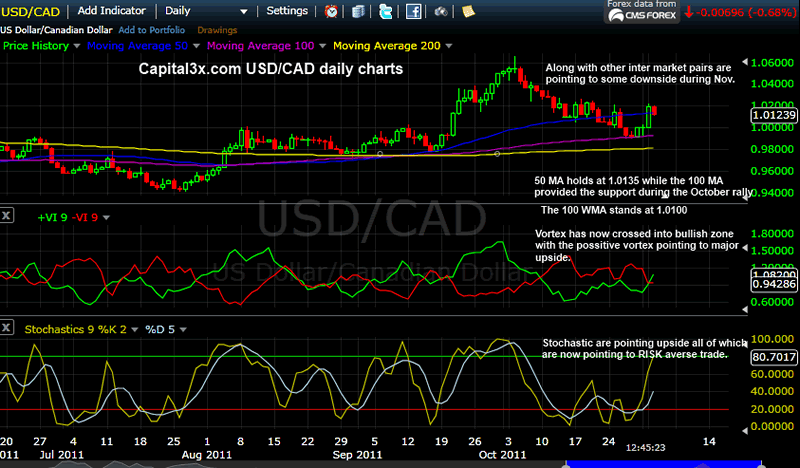
USDCAD derives its strength off weakness in Oil. Given that crude is poised for a major pullback, we expect USDCAD to trade higher. Both vortex and stochastic are pointing to fresh gains even to the Sept highs.
Third pair that combine with USDCAD and USDCHF to form the bedrock of FX analysis in relation to risk, is the AUDUSD pair:
AUD/USD Daily
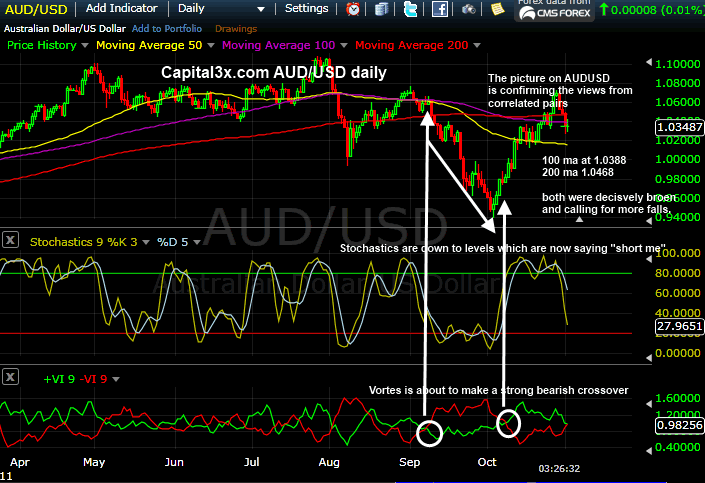
AUDUSD is highly pressured as it has broken all MA including 200,100 and 50 MAS on the same day when RBA announced rate cut sighting weak economic reality which was enough to pump USD. The falling Aussie, one of the best barometers of risk, is giving advanced signals of the impending fall in markets.
As all three pairs are combining to provide insight unavailable elsewhere, we can conclude at the first level, that we are facing the return of fear and risk aversion in the next few weeks.
But no analysis on FX and Risk is complete without looking at the queen of all pairs, EUR/USD:
EURUSD Daily
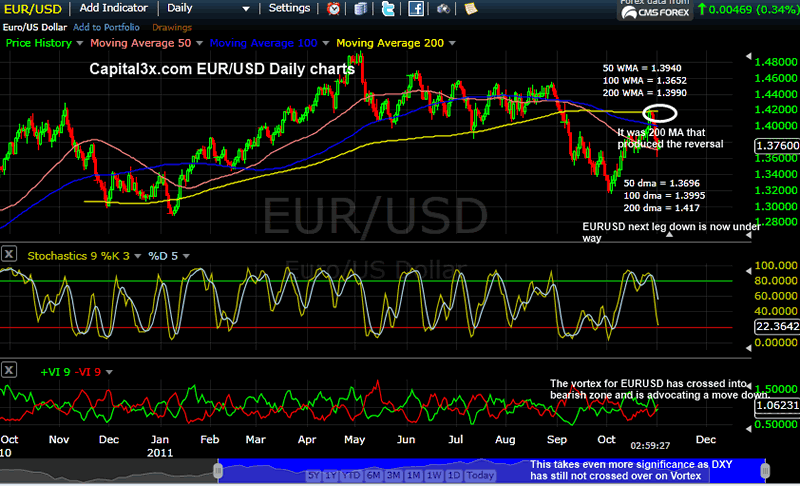
EURUSD is presenting a far more clearer picture as it moves down in to a strong downtrend. We believe initial volatility, EURUSD is about to break down. Vortex and Stochastic confirm this thesis. On the daily charts, the pair reversed from the 200 MA which was one of the strongest fake breaks we have seen on this pair. The move back to test sept lows are now underway.
EURUSD is a rare pair which derives its price action via spot market ground reality as EUR volatility is able to generate significant information about future prices.
EUR 3 M Volatility
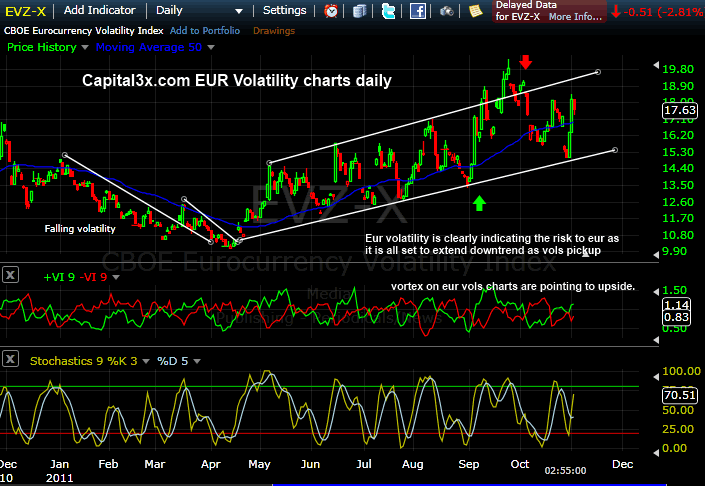
EUR volatility bounced of its lows as it sprung back into the uptrend with eurusd resultant slide by over 500 pips. We expect vols to continue rise to the top of the channel after consolidation here.
EURUSD also derives its strength of BUNDs which broke out at 136 to touch a high of 138.13. We expect bunds to retrace to 136 to test the break and if held, we expect bunds to move and break 138.13 for fresh highs. The resultant carnage in risk markets will justify our title “Return of Risk in Nov”.
TO test the standing of risk in equity markets, we take a look at Monthly charts for SP 500.
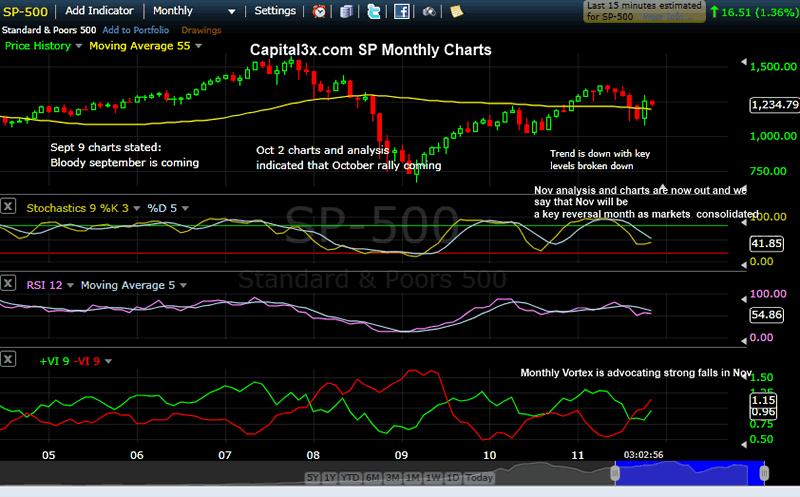
The charts are pointing to multi month move down with both stochastic and vortex advocating such a move.
SP Daily charts
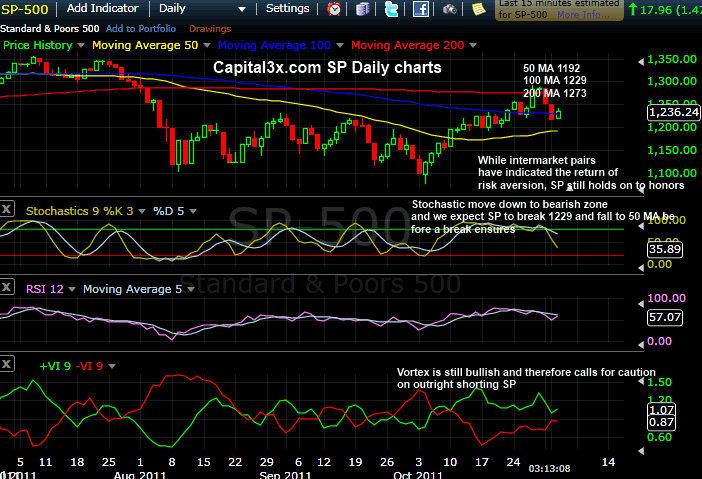
On the daily charts, we see the granular moves. The MA confluence and clusters are being eroded but given the bias in FX and Bond markets, we believe SPX is set to make new lows in Nov. A wave of risk aversion is coming in Nov weeks.
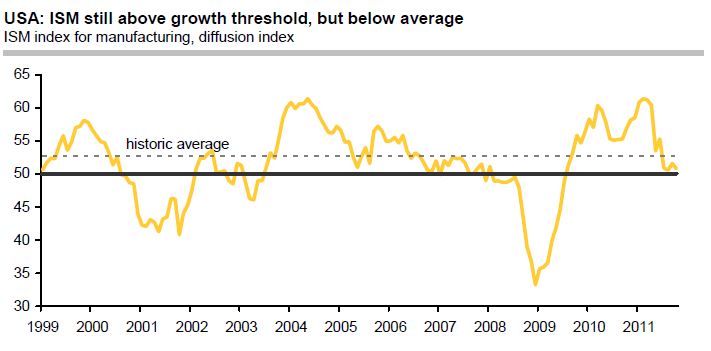
On the macro and fundamental side, US ISM continue to slow and fall to 50 mark, a break of which for more than 3 months will indicate recession and contraction. The ISM index for manufacturing slipped 0.8 to 50.8 in October.
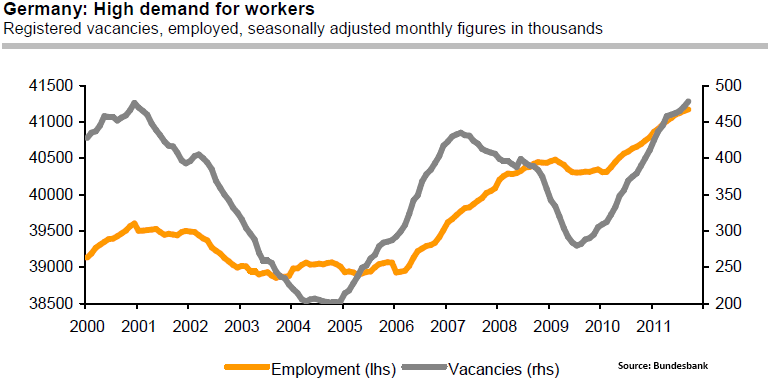
In Germany, labor markets seem to be finding a tough spot as unemployment in Germany rose by 10k in Oct 2011.
Thank you
C3X
At C3X we trade trends and use INTER-MARKET analysis and information to arrive at trend which are then utilized in a model to arrive short term trades for forex, bond markets and equity markets. We also employ a live trading room for subscribers to be able to interact.
We continue to watch the price action and will update our premium subscribers with new analysis and charts. Our trade portfolio (Forex, SPX Emini, Crude, Gold, Silver) is visible to our premium subscribers
Our feeds: RSS feed
Our Twitter: Follow Us
Kate
Capital3x.com
Kate, trading experience with PIMCO, now manage capital3x.com. Check performance before you subscribe.
© 2011 Copyright Capital3X - All Rights Reserved
Disclaimer: The above is a matter of opinion provided for general information purposes only and is not intended as investment advice. Information and analysis above are derived from sources and utilising methods believed to be reliable, but we cannot accept responsibility for any losses you may incur as a result of this analysis. Individuals should consult with their personal financial advisors.
© 2005-2022 http://www.MarketOracle.co.uk - The Market Oracle is a FREE Daily Financial Markets Analysis & Forecasting online publication.