


Stock and Commodity Markets Make Or Break
Stock-Markets / Financial Markets 2011 Nov 18, 2011 - 02:08 AM GMTBy: Puru_Saxena

 BIG PICTURE – The global economy is slowing down, most of Europe is in recession and the US is also on the verge of a contraction. Nonetheless, the ‘risk on’ trade has raged over the past month and somehow, the market seems to be oblivious to the real economy.
There can be no doubt that the past month has been difficult for us, not least because the surge in risk appetite has hurt our defensive posture (modest ‘short’ exposure with a large dose of US Dollar cash). However, despite the recent rally in ‘risk’, we are not convinced about the sustainability of this advance.
Currently, a number of markets are trading around key levels and before we participate in the ongoing festivities, we want the market to reveal its hand. In other words, rather than predict, we want the various markets to establish clear trends, so that we can align ourselves in the appropriate manner. Put simply, as the following charts will demonstrate, various markets are at a ‘make or break’ point and the next few trading sessions will confirm the direction of the primary trend.
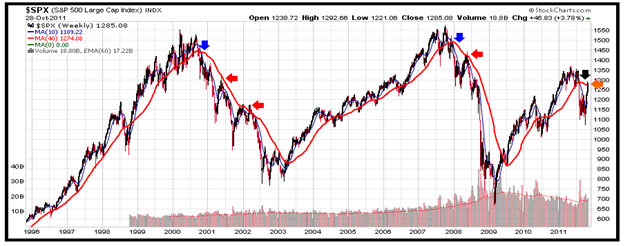
Firstly, we present the long-term chart of the S&P500 Index (Figure 1). Please note that this is a weekly chart and the thick red line represents the 40-week (200-day) moving average. As you can see, over the past 16 years, whenever the S&P500 Index was in a primary uptrend, the red line always sloped upwards. In other words, despite numerous corrections and pullbacks during previous primary uptrends, the 40-week moving average never declined! Next, please observe that the 40-week moving average only peaked and declined at the start of the two previous primary downtrends (blue arrows on the chart).
Figure 1: S&P500 Index (1996-Present)
Source: www.stockcharts.com
Furthermore, it is interesting to note that during the previous two primary downtrends, the S&P500 Index staged impressive rallies which ended around the 40-week moving average (red arrows on Figure 1). Back then, those rallies felt like the ‘real deal’, yet the S&P500 Index promptly gave back those gains and then some.
Turning to the present cycle, the S&P500 Index’s 40-week moving average peaked in August (black arrow on Figure 1). This is what prompted us to abandon our ‘long’ positions and reposition the portfolio for the downtrend.
Unfortunately (for us), the S&P500 Index has rallied over the past few weeks and it is currently trading close to its 40-week moving average (orange arrow on Figure 1). Unquestionably, this rally has been swift and many are now proclaiming the start of a new uptrend. Now, we must admit that we have no predictive powers and do not know what the future will bring. However, if you inspect Figure 1 carefully, the recent rally appears very similar to the counter-trend rallies which occurred during the previous two primary downtrends.
At this stage, the pendulum could swing either way, but the good news is that we are prepared for any outcome. If this rally proves to be sustainable, the S&P500 Index will soon start to climb and break away from its 40-week moving average. If the S&P500 manages to close 5% above its 40-week moving average, then the odds will favour the continuation of the uptrend. Under this scenario, we will exit our ‘short’ positions. Furthermore, if the 40-week moving average starts its ascent, we will re-invest capital for the uptrend.
Conversely, if the market is still gripped in a primary downtrend, the S&P500 Index will soon reverse course and global stock and commodity markets will fall. Under this scenario, we will maintain our modest ‘short’ positions and continue to keep cash; which will serve as ‘dry powder’ towards the end of the downtrend.
Given the state of the world economy, we are of the view that the downtrend will prevail. However, we have been proven wrong in the past, so our opinion is largely irrelevant. Look. In the investment business, everyone gets it wrong from time to time and success does not depend on an investor’s fortune-telling ability. Instead, success or failure boils down to risk management. On balance, those who are able to keep an open mind are more likely to come out ahead over the long-term. Moreover, those investors who have rigid views and a burning desire to be right are not likely to succeed. Most importantly, those who cut their losses and run their winning trades are bound to succeed.
Keeping in mind these simple truths, we have amended our investment strategy to protect each open trade with a trailing stop loss. This way, if any of our open position starts showing a modest loss, we will be able to ‘fix’ the problem by exiting at a pre-determined level.
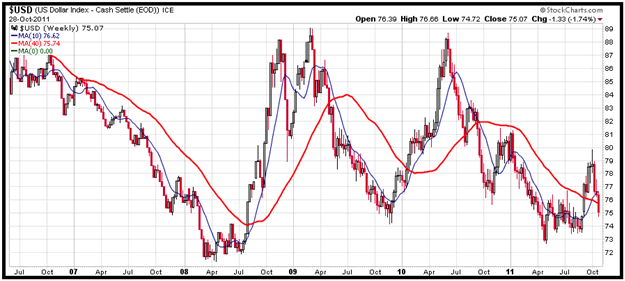
Next, we want to show you the world’s fever chart, otherwise known as the US Dollar Index. There is no secret that whenever the world’s economy catches a cold, the reserve currency puts on quite a show. After all, you may remember that the US Dollar appreciated significantly during the last recession (Figure 2).
As it turns out, the world’s reserve currency did begin to appreciate in August and after a brief spike, it is currently trading around its 40-week moving average. Thus, just like the S&P500 Index, the US Dollar Index is also trading at a critical level and its next direction will seal the fate of the world’s stock and commodity markets. Should the US Dollar Index rally violently and surpass its recent peak, the die will be cast and the recession will be confirmed. Conversely, if the US Dollar falls below its summer low, the rally in ‘risk’ will probably continue.
Figure 2: US Dollar Index
Source: www.stockcharts.com
At this point, we wish to mention that the recent weakness in the US Dollar is largely due to the euphoria surrounding the European bail-out. Moreover, bearing in mind Europe’s debt problems, we are surprised by the recent strength in the single currency.
Investors should remember that apart from offering a broad promise, the European leaders have not disclosed any relevant details. For starters, they have not stated how the EFSF will be financed and how they will magically leverage it by a factor of four. Nor have the policymakers revealed the exact details of Greece’s ‘voluntary’ default! Nevertheless, the market seems to have decided that somehow Europe’s debt crisis is fixed and perhaps, this explains the recent strength in the Euro. The market’s fickle nature notwithstanding, we are of the view that not much has been fixed in Europe and the single currency’s strength should prove to be temporary. If our assessment is correct, further weakness in the Euro will boost the US Dollar Index, thereby curbing the ongoing rally in risky assets.
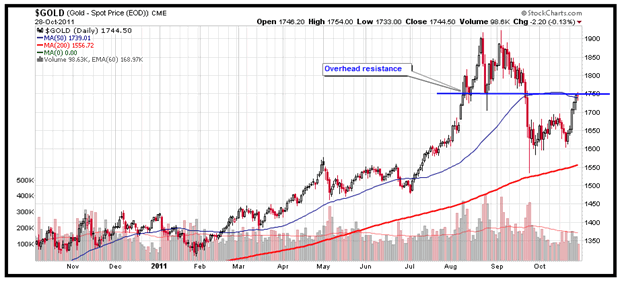
Finally, we want to end this discussion of ‘make or break’ by showing you another interesting chart. Figure 3 is gold’s daily chart and it is yet another example of one more important market trading at a critical juncture.
As you can see, gold sold off sharply in early September and promptly fell back to its 40-week or 200-day moving average (red line on chart). Thereafter, the yellow metal spent a month building a base and the recent European announcement caused it to rally. It is notable that the European bail-out ‘news’ has taken gold back to its 50-day moving average (blue line on chart), an area which is around significant overhead resistance. Thus, gold is yet another market trying to figure out its next direction and at this stage, there is no way of knowing whether the recent rally will succeed or end. Given the prevailing uncertainty and the history of sharp price declines during recessions, we are currently out of this asset.
Figure 3: Gold – which way will it go?
Source: www.stockcharts.com
With so many key markets currently trading around critical levels, we do not wish to speculate and are quite happy to watch the drama with a significant amount of ‘dry powder’. However, when the picture becomes clearer and firmer trends are established, we will act swiftly.
In summary, although the deteriorating economic backdrop calls for a downtrend in stocks and commodities, we are not taking anything for granted and remain prepared for any outcome. Should the downtrend in stocks and commodities resume, we will maintain our current strategy. On the other hand, if the rally in ‘risk’ continues and the downtrends are negated, we will abandon our ‘short’ exposure and re-allocate capital to appropriate assets.
Puru Saxena
Website – www.purusaxena.com
Puru Saxena is the founder of Puru Saxena Wealth Management, his Hong Kong based firm which manages investment portfolios for individuals and corporate clients. He is a highly showcased investment manager and a regular guest on CNN, BBC World, CNBC, Bloomberg, NDTV and various radio programs.
Copyright © 2005-2011 Puru Saxena Limited. All rights reserved.
© 2005-2022 http://www.MarketOracle.co.uk - The Market Oracle is a FREE Daily Financial Markets Analysis & Forecasting online publication.