Stock Market Sitting on Nothing But Air, Dollar About to Breakout?
Stock-Markets / Financial Markets 2011 Nov 21, 2011 - 02:26 AM GMT -- The VIX pullback to intermediate-term trend support at 32.08. It is on a weekly buy signal, having crossed above its 4-year cycle support at 27.26 (red line). The buy signal is confirmed on the daily chart, as it is necessary to remain at or above intermediate-term Support/Resistance. The current buy signal remains in effect for a probable three weeks or longer. That indicates the probability of strong positive momentum in the Volatility Index lasting through early December.
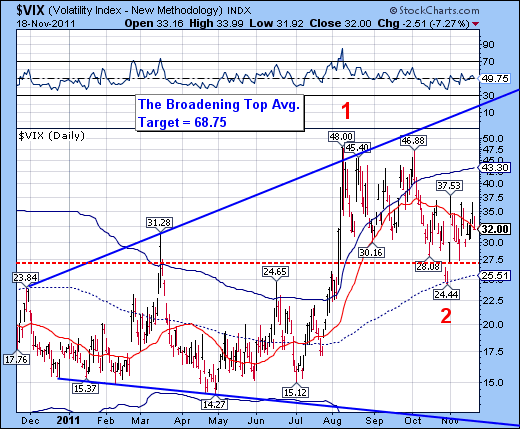
Nothing but air…
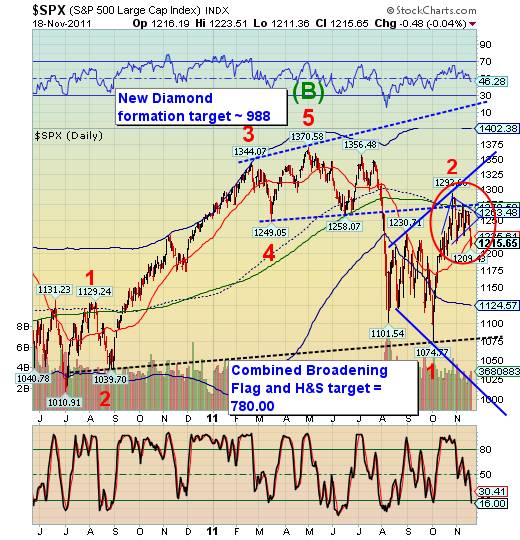
-- The /SPX broke through all nearby support levels and has nothing but air all the way down to its massive Head and Shoulders neckline at 1075.00. It is on a cylical sell signal, having retreated below mid-cycle Support/resistance at 1263.48. On Thursday I issued a flash crash alert. It does not appear that the lower cycle boundary will offer any support on the way back down to the October low.
The current cycle pattern calls for another three weeks of decline. This may result in a two-phase decline from here. The first decline has the neckline clearly in its sights. The second phase may involve a bounce to retest the neckline, been a plunge to the final target low.
Support for the Euro may not last.
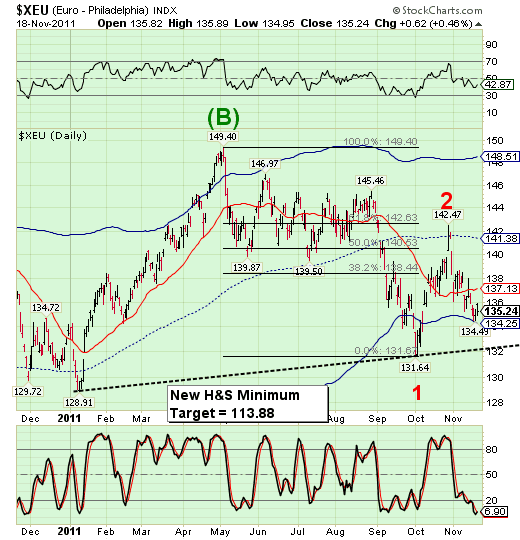
-- The Euro has bounced off its cycle bottom support at 134.25. It remains on a sell signal while below intermediate-term trend resistance at 137.13. After establishing a Master Cycle low in early October, the XEU has launched into its first Trading Cycle. It now leads the equities markets and appears to have near 100% correlation to equities as well. The Euro is expected to continue its decline into the first week of December.
There is a potential new Head & Shoulders neckline at 132.00. When crossed, it will generate a minimum target of 113.88. The low on October 3 was a Master Cycle low. The significance of the failure of XEU at 142.47 is immense, since the new cycle is extremely left-translated and those who are short may benefit immensely. Master Cycles last 8 months or more, suggesting the downtrend in the XEU may continue until June 2012. Could this mean the death of the Euro?
Is the US Dollar ready to break out?
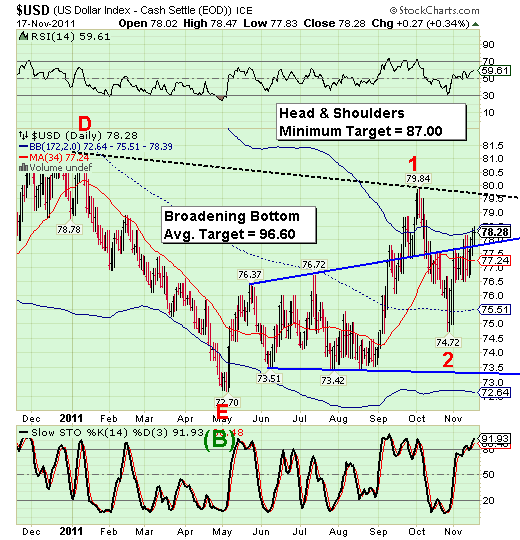
-- The dollar appears to have consolidated its gains above its Broadening Formation trendline. It may now be ready to break above cycle top support/resistance at 78.39. In third waves, indexes often ride atop cycle top support as the trend channel turns up. This typifies a strong momentum driven move
Not only does the dollar appear poised to break above its cycle channel, it also appears ready to break above a large inverted head and shoulders neckline. Once this happens, it will set the stage for the next six months in the dollar.
The trap door is sprung in gold.
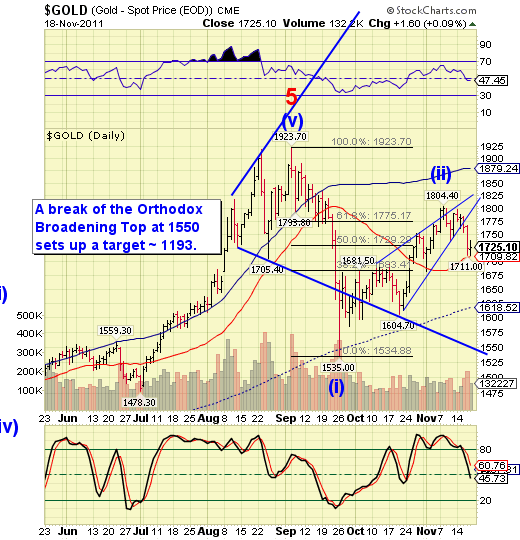
-- Gold broke out of its Bearish Wedge this week and came to rest at intermediate-term trend support at 1709.82. Bearish Wedges are completely retraced, so the expectation is the next leg of the decline will take out the lower trendline of the Orthodox Broadening Top. The sell signal from the broken Bearish Wedge is confirmed by a decline below intermediate-term trend support. The sell signal is reinforced even more at the crossing of mid-cycle support at 1618.52.
The trading cycle calls for a significant low in gold by the end of next week. However, gold may remain week up to the Christmas holidays.
U.S. Bonds remain an enigma.
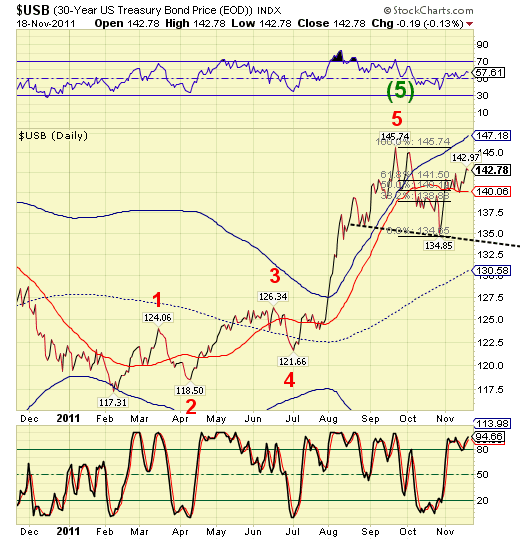
-- This week USB advanced above its 61.2% Fibonacci retracement level of 141.50. The head and shoulders neckline at 134.85 is starting to look awkward, but remains appropriate unless USB rallies above 145.74. USB remains overbought and poised for a decline below 140.06, its intermediate-term trend support.
The need for liquidity by European banks may override the desire for the relative “safety” of U.S. Treasuries. In addition, budget talks are collapsing. A reversal below the Head & Shoulders neckline may spell the doom of the 30-year old rally in treasuries.
Oil reversed at its cycle turn date.
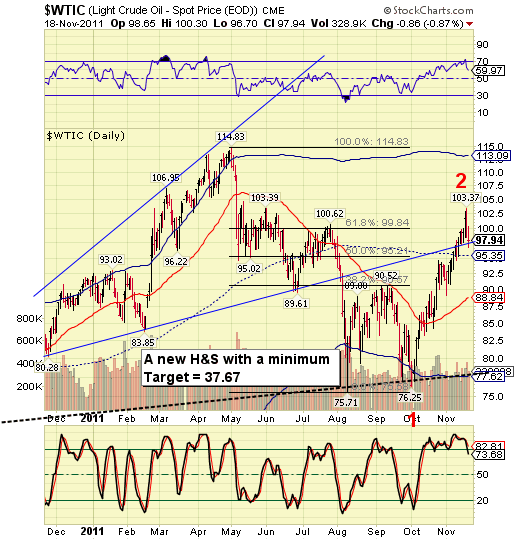
--West Texas Crude reversed on Wednesday, its Primary Cycle turn date. A cyclical sell signal is generated by crossing below midcycle support at 95.35. It may be further confirmed by crossing below intermediate-term trend support at 88.84. Its initial target is its head and shoulders neckline at 77.75. Should it break through, there may be additional selling to a much lower target enumerated on the chart.
For the most part, West Texas crude appears to be correlated with our domestic equities. That suggests that oil may be linked with stocks in decline lasting possibly three more weeks. It also appears that oil may be a crash pattern along with our domestic equities.
China stocks are in a pullback.
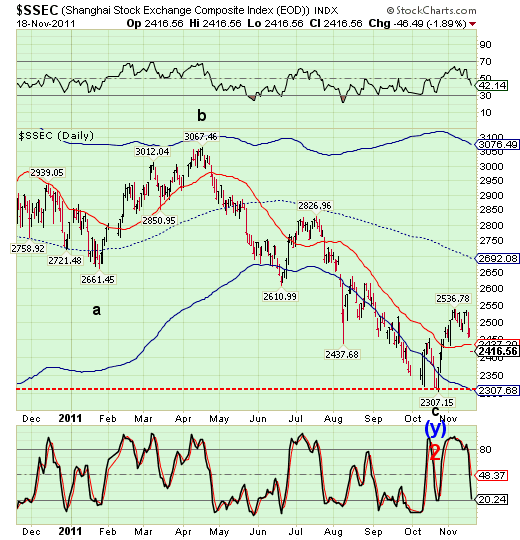
The Shanghai Index gapped down through intermediate-term trend support at 2427.30, negating its buy signal. This move puts us in neutral on the Shanghai index, while a decline below 2307.15 implies a resumption of the downtrend. As a precaution, I suggest monitoring the behavior of the Shanghai index while U.S. equities are in full decline. Should support hold while our stocks and bonds sell off, it suggests a new “safe haven” for money flows out of the U.S. and Europe.
The banking index is in full retreat.
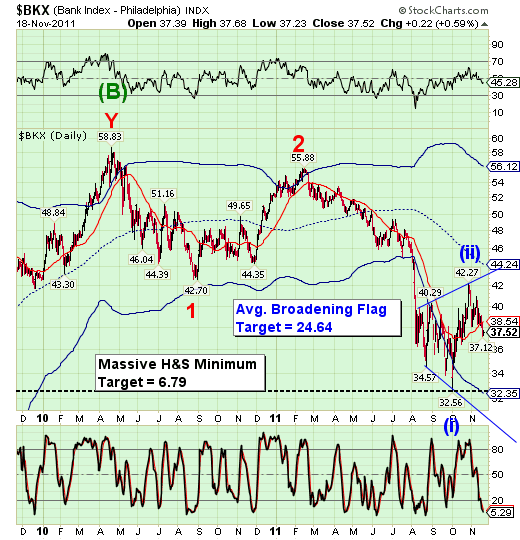
The banking index slipped below intermediate-term trend support at 38.54 and seems destined to continue its decline below the massive head and shoulders neckline at 32.50. Not only should the banks be concerned about Europr, but domestic problems are also emerging. Could this be the Waterloo for a major banks in this country? The implications are enormous.
Good luck and good trading!
Regards,
Tony
Our Investment Advisor Registration is on the Web
We are in the process of updating our website at www.thepracticalinvestor.com to have more information on our services. Log on and click on Advisor Registration to get more details.
If you are a client or wish to become one, please make an appointment to discuss our investment strategies by calling Connie or Tony at (517) 699-1554, ext 10 or 11. Or e-mail us at tpi@thepracticalinvestor.com .
Anthony M. Cherniawski, President and CIO http://www.thepracticalinvestor.com
As a State Registered Investment Advisor, The Practical Investor (TPI) manages private client investment portfolios using a proprietary investment strategy created by Chief Investment Officer Tony Cherniawski. Throughout 2000-01, when many investors felt the pain of double digit market losses, TPI successfully navigated the choppy investment waters, creating a profit for our private investment clients. With a focus on preserving assets and capitalizing on opportunities, TPI clients benefited greatly from the TPI strategies, allowing them to stay on track with their life goals
Disclaimer: The content in this article is written for educational and informational purposes only. There is no offer or recommendation to buy or sell any security and no information contained here should be interpreted or construed as investment advice. Do you own due diligence as the information in this article is the opinion of Anthony M. Cherniawski and subject to change without notice.
Anthony M. Cherniawski Archive |
© 2005-2022 http://www.MarketOracle.co.uk - The Market Oracle is a FREE Daily Financial Markets Analysis & Forecasting online publication.


