


U.S. Treasury Bonds About To Plunge? Implications For Stocks and Gold Silver
Stock-Markets / Financial Markets 2012 Dec 28, 2011 - 08:04 AM GMTBy: Willem_Weytjens

 Are Bonds about to plunge? And if so (or if not), what are the implications for stocks and precious metals?
Let’s have a look at TLT, which is the iShares Barclays 20+ Year Treasury Bond Fund.
Back in 2008, at the climax of the financial crisis, TLT was very stretched above the 200MA, and the RSI was very oversold on a weekly basis.
Recently, we had a similar situation, although right now, RSI is not oversold anymore but instead is forming negative divergence, as it sets lower highs and lower lows on the weekly chart, while price recently set a potential double top.
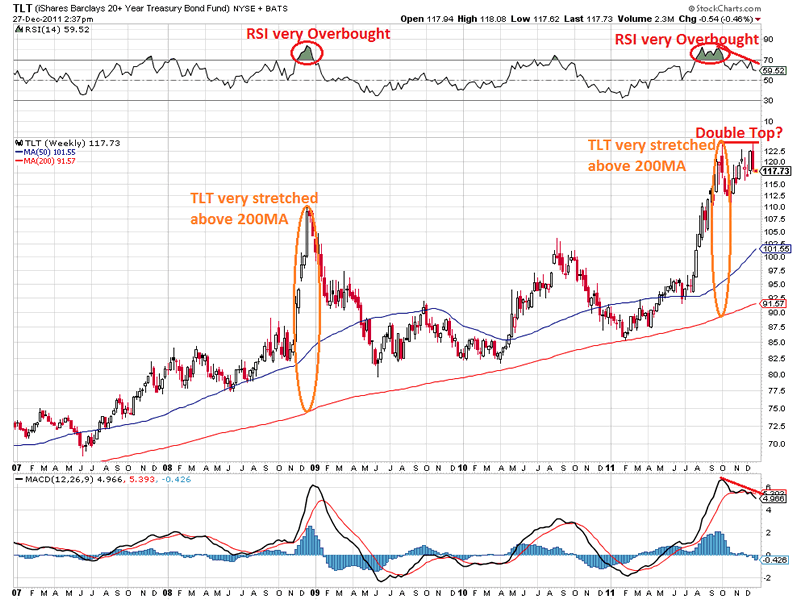
Chart courtesy stockcharts.com
When we look at TLT until 2010, we can see that price retraced exactly back to the 50% Fibonacci Level, where it found strong support.
This level also happend to be a level where the long term trend line came in…
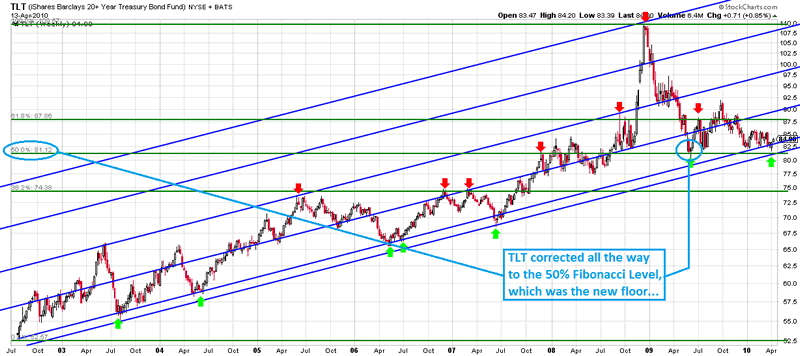
Chart courtesy stockcharts.com
If bonds would top here, that would likely be caused by investors rushing out of this (perceived) risk-free asset class, and into more risky assets like stocks.
That would probably involve a more sustainable (or at least more sustainable as perceived by the market participants) way out of this Euro Crisis, which has been making headlines in recent months, causing investors to rush out of risky assets and into bonds.
We can see from the Commitment Of Traders (COT) reports that Commercials (usually seen as the “Smart Money”) have taken on HUGE long positions in the EURO, while Speculators (usually seen as the “Dumb Money”) have taken on HUGE Short positions:
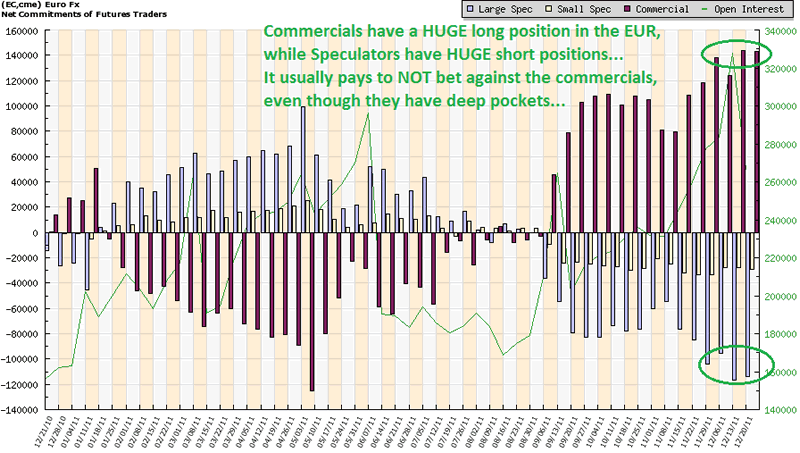
However, Commercials have deep pockets and can stand the dips (which they usually keep buying)…
If bonds haven’t topped yet, we can expect a potential top around 132 for TLT, based on Fibonacci Retracement levels.
If it would top there, and retrace 50% of its move, it should drop towards 92.5, where once again, the long term uptrend support line comes in…
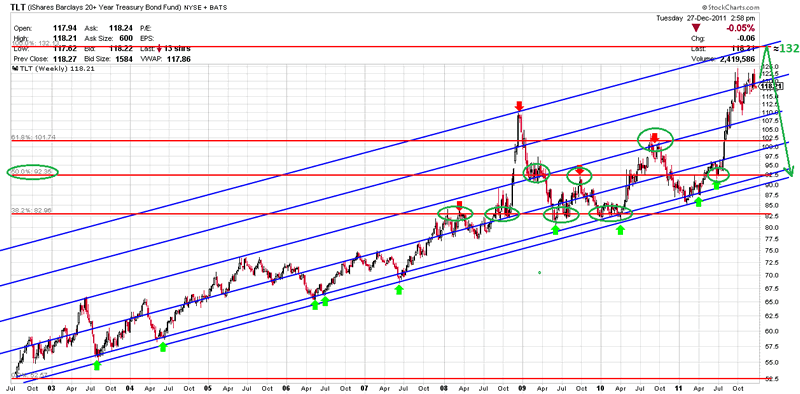
Chart courtesy stockcharts.com
A continued rise of Bonds would probably mean more worries about the Euro Crisis.
In the EURO chart, we can notice a potential Head & Shoulders pattern, which could send the EURO as low as 1.15 if the pattern holds…
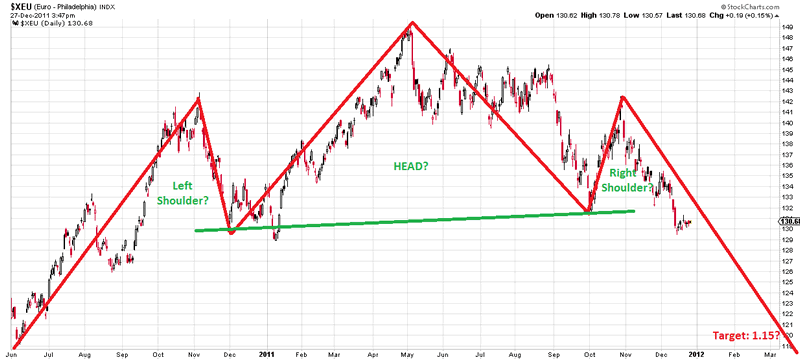
Chart courtesy stockcharts.com
However, on a short term daily basis, the Euro shows (weak) signs of Positive Divergence.
On the other hand, it also seems to be stuck in a bear flag (very short term).
If the MACD would fall below the low of last week, this would probably lead to a further decline in the EURO, meaning we should keep an eye on the Head & Shoulders pattern…
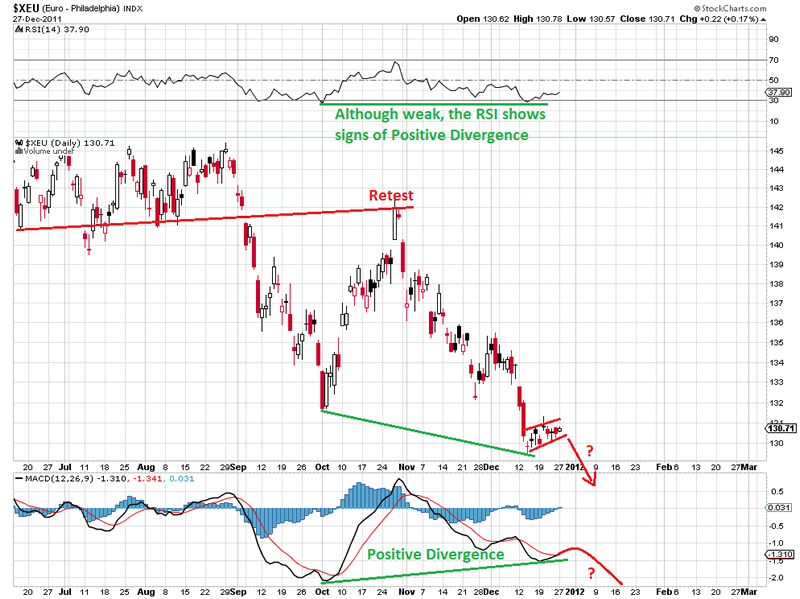
Chart courtesy stockcharts.com
I keep finding it fascinating to look at the similarities between now and 2008, as the SP500 still hasn’t broken that 200MA and heavy resistance at 1265-1280… Once it does, I think we would see new highs pretty soon.
If it doesn’t, look out below…
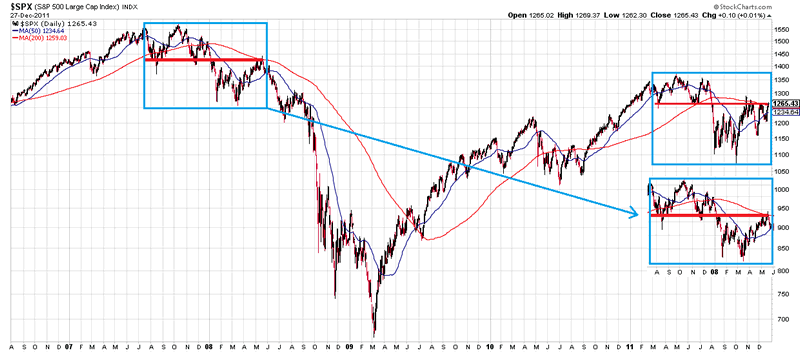
Chart courtesy stockcharts.com
Last but not least, let’s think about what will happen to Precious Metals if Bonds top here.
We can look at it in 2 ways:
* A top in bonds probably means investors become less risk-averse, meaning Gold could also sell-off (as it is often perceived as a hedge against turmoil)
* However, gold has rather acted as a risky asset lately and has already sold-off quite a lot, meaning investors could start to load up the truck as they see the recent dip as an opportunity to buy…
Let’s have a look at the TLT:GLD chart, which divides the price of TLT by the price of GLD.
We can see that during the last 7 years, TLT has severely underperformed Gold, as the ratio has declined substantially.
When we have a closer look, we can notice 5 times where the ratio showed signs of Negative Divergence.
Everytime this happened, it marked a top in the TLT:GLD ratio, meaning TLT started to underperform GLD soon thereafter (or equivalently, Gold started to outperform TLT). Will this time be any different?
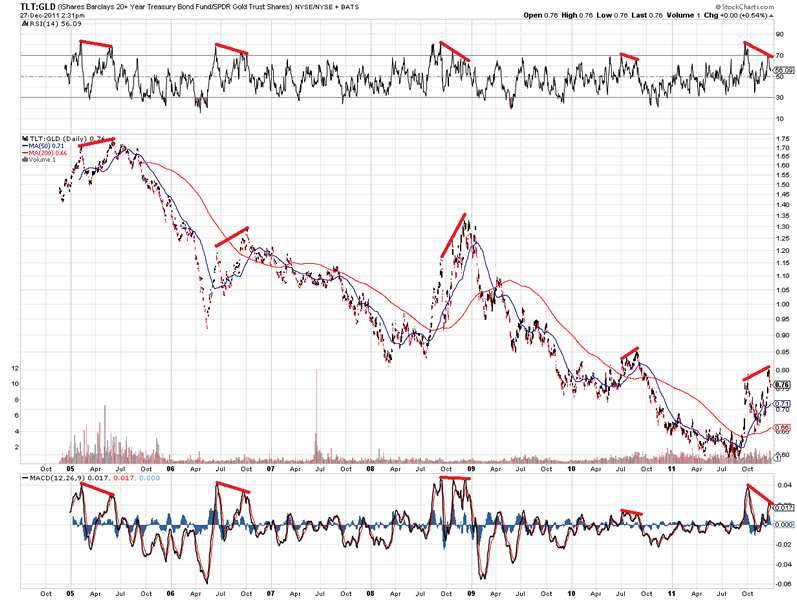
Chart courtesy stockcharts.com
Based on Sentiment in Gold (but especially Silver) and the recent decline, I would assume this time Gold is seen as a “risky” asset, and should thus profit from a top in TLT/Bonds, although the risk of further declines still exists.
For more analyses and trading updates, please visit www.profitimes.com
Willem Weytjens
www.profitimes.com
© 2011 Copyright Willem Weytjens - All Rights Reserved
Disclaimer: The above is a matter of opinion provided for general information purposes only and is not intended as investment advice. Information and analysis above are derived from sources and utilising methods believed to be reliable, but we cannot accept responsibility for any losses you may incur as a result of this analysis. Individuals should consult with their personal financial advisors.
© 2005-2022 http://www.MarketOracle.co.uk - The Market Oracle is a FREE Daily Financial Markets Analysis & Forecasting online publication.