“Planets’ Amazing Influence on Stock Market. What Lies Ahead?”
Stock-Markets / Financial Markets 2012 Mar 08, 2012 - 07:23 AM GMTBy: Submissions
 Dincer YILMAZ writes: Since the ancient times, Sun has been thought of representing gold. Today’s modern astrology not only relates gold to Sun but also general stock market and speculative motivations. Horoscope’s 5th house represents children, public amusement, love, speculative markets and collective human action. The ruler of the 5th house is deemed as Sun, so other planets’ influence on Sun can help us to forecast which way the market will go in the future.
Many financial astrologers use only geocentric charts (geocentric means ‘Earth centered’) in their analysis. This strategy is wrong. Admittance of Sun as the main influencing star on stock market requires heliocentric charts (heliocentric means ‘Sun centered’) to be included into the analysis. When it comes to Sun, only Earth, Venus and Jupiter can significantly affect solar activities either positively or negatively. NASA frequently updates solar cycles and we see that ebb and flow movements are directly connected to these planets’ positions. In addition malefic planets’ (Mars, Uranus, and Saturn) hard angles (squares and oppositions) have always had great influence on speculative activities throughout history. This is difficult to prove mathematically but one should consider the fact that our knowledge cannot cover everything in the universe.
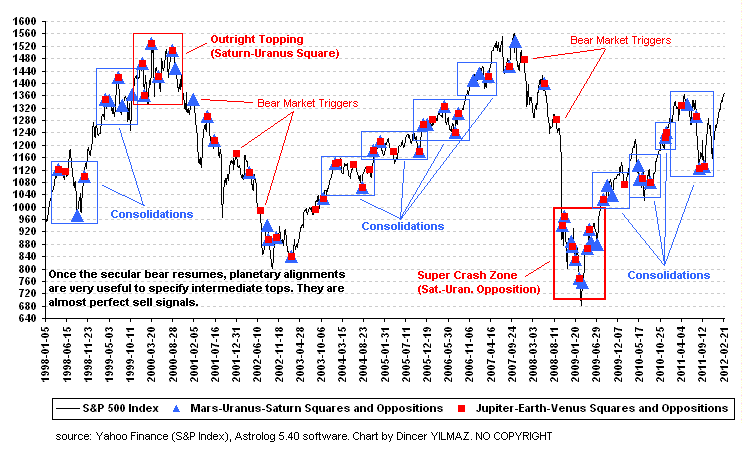
Below chart spots S&P Large Cap Index weekly closing values from 1998 to 2012, and also (1) the dates when hard angles between Earth, Venus and Jupiter occurred on heliocentric charts (2) the dates when hard angles between Mars, Uranus and Saturn occurred on both heliocentric and geocentric charts. Of course not every hard angle is included; there must at least 2 hard angles at the same time or 1 angle coupled with a conjunction by another influential planet.

The results are very interesting. First of all, it can clearly be seen that once the secular bear starts or resumes, planetary alignments function as almost perfect sell signals. I called these alignments ‘bear market triggers’. On the other hand, when bull starts to march, the same alignments draw the boundaries of ‘consolidation areas’. They can be very useful to specify the start and end of the consolidation periods. In order to determine whether alignments mark major tops and bottoms or not, we check multiple Saturn-Uranus squares (late 1999-early 2000) or multiple Saturn-Uranus oppositions (late 2008-mid 2010) as both long term topping & super crash zones and rock-bottom formations.
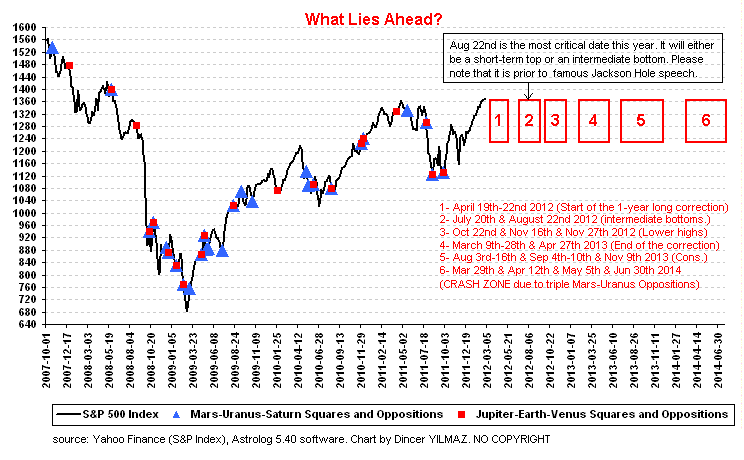
The main advantage of astrological forecast lays in the availability of precise information even hundreds years in advance. However, in the absence of long term topping and super crash formations, hard angles do not give outright clues to specify turning points exactly. Yes, they are good at calling tops and bottoms but trend changes require more focus. For example, it took me until January 2008 to mark October 2007 major top. Similarly, this year’s most critical date, August 22nd 2012, won’t show its hand till last minute. We will see whether it is an intermediate bottom or a short term top probably after Bernanke’s famous Jackson Hole speech.
And the question comes: What lies ahead? Below chart is of a shorter time frame and outlines 6 critical periods starting from April 2012 to June 2014, plus a few comments.

My “actually a bit more complicated” astrological model suggests that we will witness a 1 year long correction from April 2012 to April 2013 plus a 2001 style mild recession in US. The reason why a recession is highly likely is astrologically simple: on June 25th 2012 a Jupiter-Neptune square will be observed on geocentric chart and again in August 2012 on heliocentric chart. Jupiter-Neptune squares do always have a recessionary bias. Further, Uranus-Pluto square happens on the same day, June 25th, which is not good for banking sector interests, especially for core Euro banks. Plus, Saturn will start its move to Scorpio, which means plenty of conflict between lenders and debtors may loom in the horizon. But most importantly it is highly likely that Obama will not be re-elected because transit Saturn squares Obama’s natal Sun. A Republican’s victory can bring questions to mind such as “Will Bernanke be dismissed by new president?” Or “What will be the effect of a tighter budget on growth?” All these developments can easily outweigh FED’s efforts to prevent a recession.
As a few financial analysts frequently mention, we will journey in a years-long stagflationary environment. In this long journey, mid 2014 seems to be a perfect “inflection point”. If there are multiple Mars-Uranus-Saturn hard angles in a short period of time we can confidently conclude that it is a “crash zone”. Mar-Jun 2014 period will witness triple Mars-Uranus oppositions. The interval coincides with transit Jupiter’s move in conjunction with FED’s natal Neptune (the most recent ones: 1978, 1990 and 2002) Jupiter’s journey in Leo, which is a fire sign, could aggravate inflationary expectations.
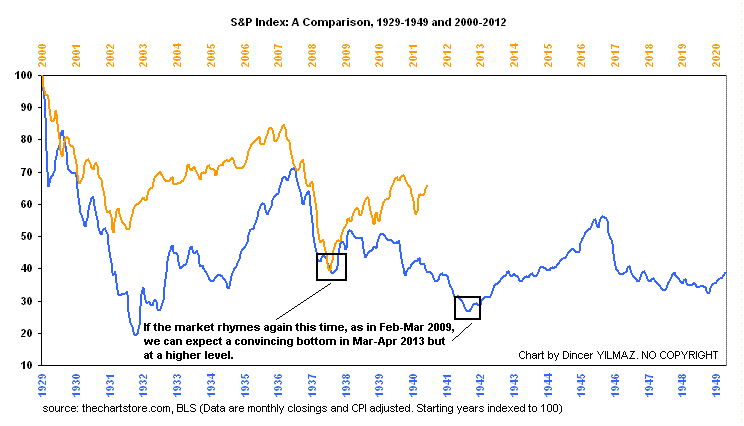
Lastly, below is one of classical comparisons between 1929-1949 and 2000-2012 periods. Data are monthly closings and CPI adjusted. Starting years indexed to 100.

If the market rhymes again this time, like in Feb-Mar 2009, we can expect a convincing bottom in Mar-Apr 2013 but probably at a higher level. Time will tell if human action duplicates itself again.
Dincer YILMAZ, CPA
E-mail of the Author: yilmadin@yahoo.com
A Short bio: Dincer Yilmaz is a senior CPA. He is not a professional astrologer or financial analyst. He is living in Istanbul, Turkey and can be reached at yilmadin@yahoo.com.
© 2012 Copyright Dincer YILMAZ - All Rights Reserved
Disclaimer: The above is a matter of opinion provided for general information purposes only and is not intended as investment advice. Information and analysis above are derived from sources and utilising methods believed to be reliable, but we cannot accept responsibility for any losses you may incur as a result of this analysis. Individuals should consult with their personal financial advisors.
© 2005-2022 http://www.MarketOracle.co.uk - The Market Oracle is a FREE Daily Financial Markets Analysis & Forecasting online publication.


