


Stocks Bear Market Focus Point: Bull Trap Warning in equities still holds
Stock-Markets / Stocks Bear Market Apr 19, 2012 - 09:34 AM GMTBy: Garry_Abeshouse

 Two months ago in my last posting, I warned of an impending Bull Trap in equities. As the hedge funds do their ‘thing’ during this week of expiring options, we see as in previous times, how easily they can create at will, short sharp rises in selected equities, that somehow seem to magically materialise from nowhere and often end up actually going nowhere. These are just the market plays of yet another market Bull Trap.
At this time of the month, the bulls amongst the Hedge Funds try to take advantage of market apathy by pushing up the markets on low volume in order to better their positions, while the bears amongst them may see their short positions being squeezed and are pushed to send the markets higher as well, while they cover their positions. But each month at option expiry time it’s technically different, depending on where the market is relative to recent bottoms and tops. These mid to late month moves in the financial markets, also make many of the media’s financial commentators look a bit stupid as they indulge in their daily search for reasons explaining the previous day’s market rises and falls.
Where do the Hedge Funds’ profits go?
According to Simon Lack’s recently published book “The Hedge Fund Mirage”, the bulk of Hedge Fund profits are not even derived from profits, but from fees charged, with apparently 97% going to insiders and a measly 3% to investors. He states that "If all the money that’s ever been invested in hedge funds had been put in treasury bills instead, the results would have been twice as good.".
As a reminder to the reader of what I said last time:
‘Bull Traps challenge our ability to see through all the media crap, (sorry, financial journalism) and newsletter promotional froth and bubble, so we may better ascertain what the future beholds.
Market tops can be an extremely drawn out process containing a series of peaks over many years, each one a Bull trap. It is all part of the long drawn out unravelling process emanating from the material and financial excesses in our past.”
This particular Bull Trap is still working its way through a complicated process, which this time includes an up and coming USA Presidential election. But as long as financial markets have been around, most of the major falls have been born from the false dawn of a Bull Trap - and I do not expect this time to be very different.
Corporate style imperialism is a highly profitable way of doing business
It just goes to show that the combination of brilliant innovation, impressive marketing, temporary lack of effective competition and essentially what should be construed as the use of slave labour, is an unbeatable combination for obtaining massive profits. But it is Peak Optimism and nothing else that defines when a market leader has reached its price peak in the financial markets. So the big question we all should be asking about Apple is – have we reached that time?
Peak optimism on future earnings of market leaders such as Apple have almost always been a key feature of major market tops. Between 2003 and 2007 Apple rose from $6.68 to $202.96. After falling to $79.14 during the financial crisis in 2008 it then rose to $644 just a few short days ago. This means the stock has doubled and redoubled approx. six and a half times since its 2003 lows just over nine years ago. (Note – I do realise that the lowest price for Apple was $1.78 in 1985, just after the introduction of its first Macintosh computer, but I consider that too far back in history to be relevant now.)
In conclusion
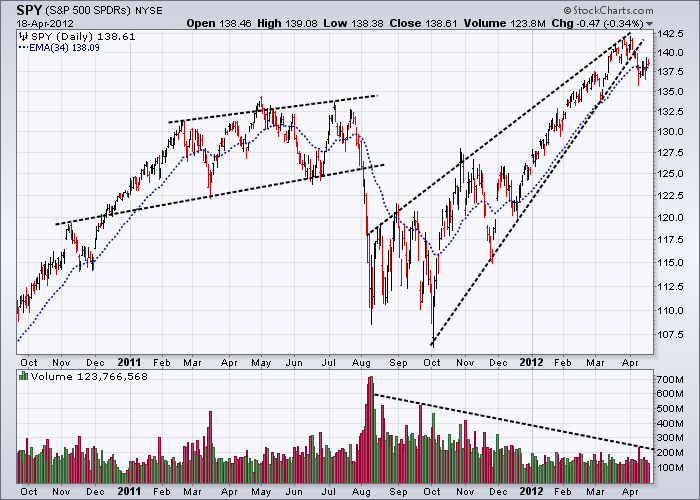
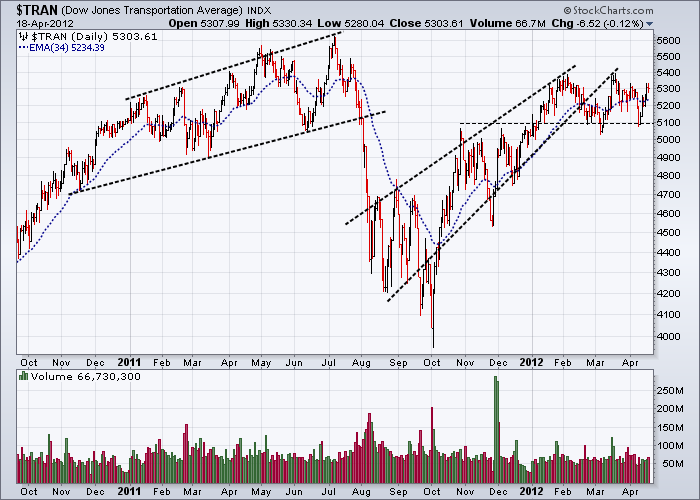
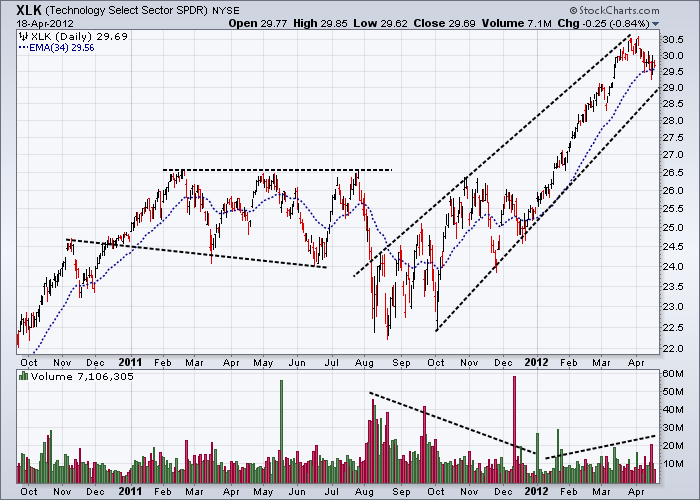
The charts I wish to highlight today are simply the ones I showed you last time on February 16th 2012 – with some minor trend adjustments. This allows you to compare the same charts over the last two months, so you can see what has or has not happened over this time. Take special notice of where current prices lie relative to price support and resistance and the trend lines shown. I shall show these same charts again over the coming months as the unravelling process continues.
And as George Soros depressingly summed up the state of the European union a few days ago, writing for Project-Syndicate.org:
‘Whether or not the euro endures, Europe faces a long period of economic stagnation or worse. Other countries have gone through similar experiences. Latin American countries suffered a lost decade after 1982, and Japan has been stagnating for a quarter-century; both have survived. But the European Union is not a country, and it is unlikely to survive. The deflationary debt trap is threatening to destroy a still-incomplete political union.’ He still sees the relationship between Germany and the rest of Europe caught up as they say ‘between a rock and a hard place’ - an intolerable situation without the prospect of a satisfactory solution in sight.
In Part 2 of this series I shall show charts highlighting the current relative weakness in commodities. This being a further sign of how the unravelling of the world’s major consuming economies are as we speak, having a negative feedback effect on countries supplying raw materials, such as Australia, Brazil and Canada and those that in turn converting those same raw materials into consumables, such as China and other low wage countries.
Daily Charts
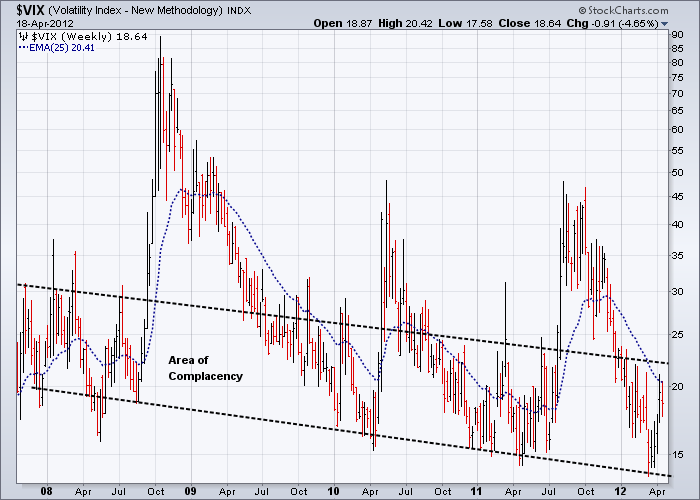
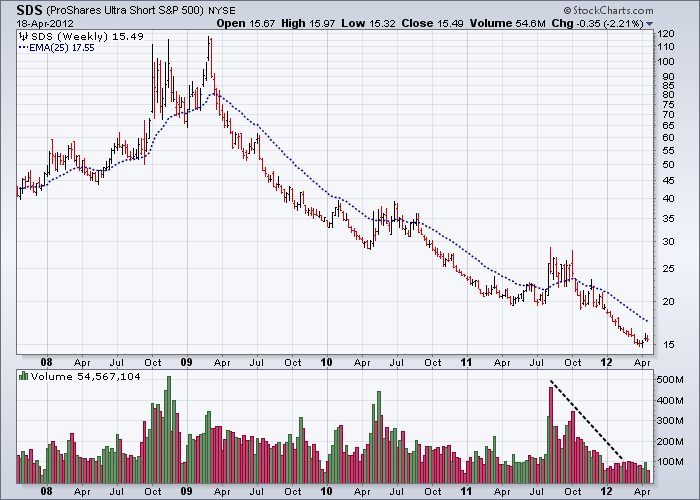
Weekly Charts
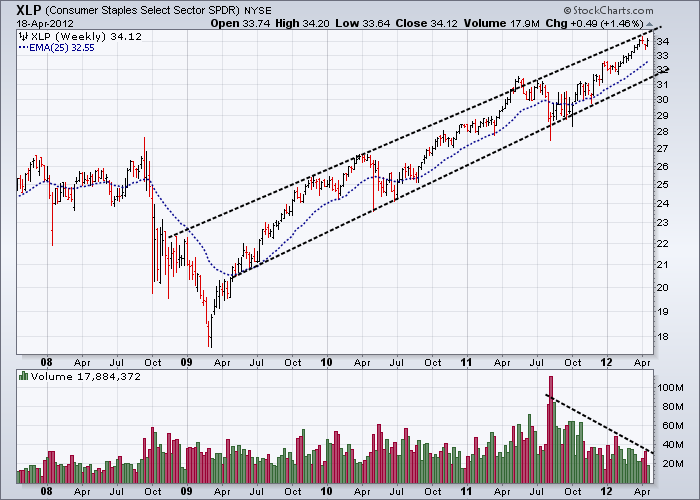
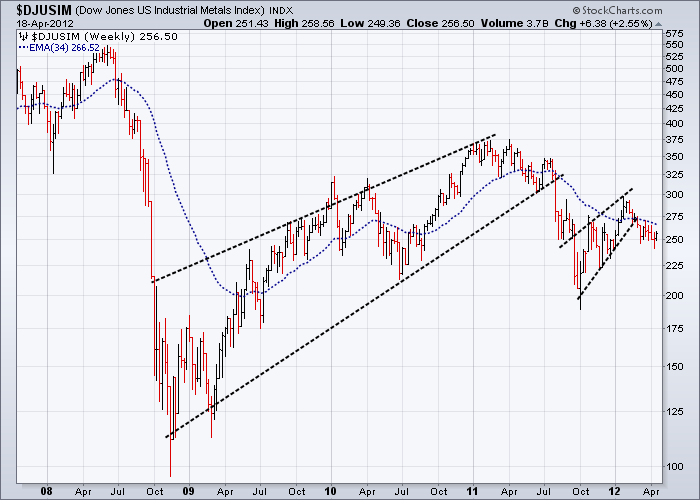
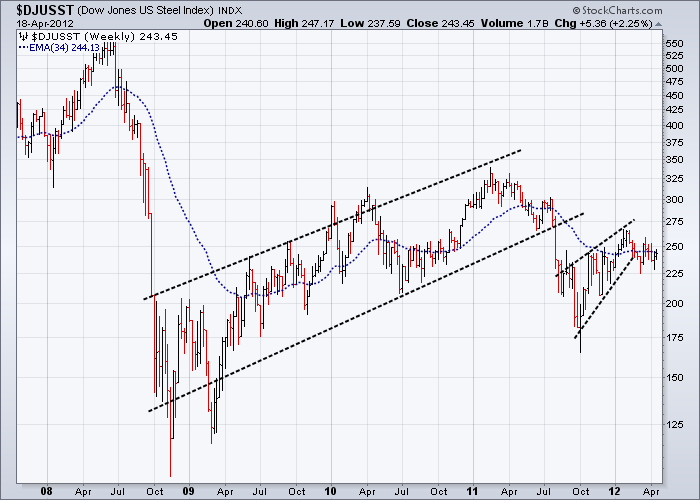
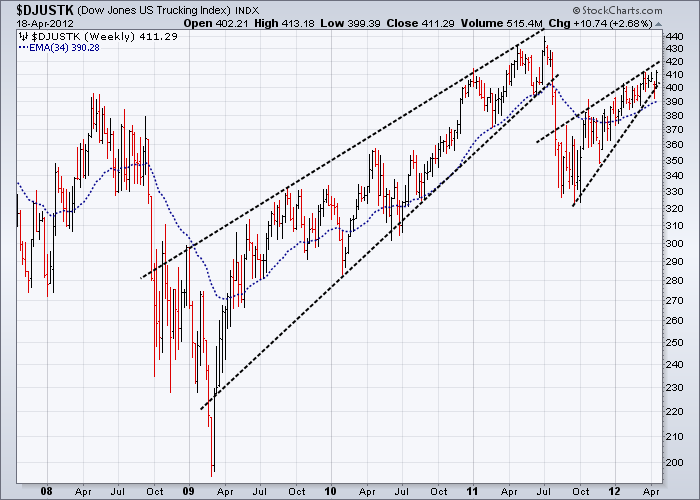
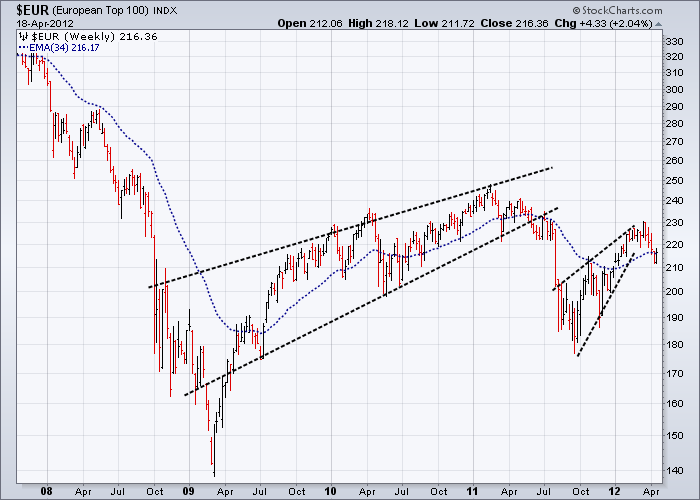
Below – Complacency still rules
Till next time.
Garry Abeshouse
Technical Analyst.
Sydney
Australia
I have been practicing Technical Analysis since 1969, learning the hard way during the Australian Mining Boom. I was Head Chartist with Bain & Co, (now Deutsch Bank) in the mid 1970's and am now working freelance. I am currently writing a series of articles for the international "Your Trading Edge" magazine entitled "Market Cycles and Technical Analysis".
I specialise in medium to long term market strategies.
© Copyright Garry Abeshouse 2012
Disclaimer: The above is a matter of opinion provided for general information purposes only and is not intended as investment advice. Information and analysis above are derived from sources and utilising methods believed to be reliable, but we cannot accept responsibility for any losses you may incur as a result of this analysis. Individuals should consult with their personal financial advisors.
© 2005-2022 http://www.MarketOracle.co.uk - The Market Oracle is a FREE Daily Financial Markets Analysis & Forecasting online publication.