Investor Sentiment at Stock Market Bottom
InvestorEducation / Stock Market Sentiment Jun 02, 2012 - 02:22 PM GMTBy: Submissions
 Ed Carlson writes: Everyone seems to be in on the ‘sentiment game’. Even non-technicians talk on CNBC and Bloomberg T.V. these days about throwing in the towel, capitulation, and washouts as if it’s something everybody watches and not just technicians. For the uninitiated the idea is that once sentiment (crowd psychology) has moved too far to one extreme (bearish or bullish) that the sentiment pendulum will then swing in the other direction. Call it reversion to the mean or what you will, it is a phenomenon which seems to hold throughout the human experience and the natural world. The ‘trick’ is to quantify an otherwise qualitative turn of events.
The most popularly quoted sentiment gauges are the CBOE Put/Call ratio, the American Association of Individual Investors (AAII) Sentiment Survey, and the Investors Intelligence Advisors report. Rydex funds and other mutual fund and ETF families make their assets under management data publically available so traders and investors can see the flow of funds in and out of their funds; too much money coming in? Contrarians believe investors have become too bullish and it may be time to get bearish.
Getting the information is the first challenge. Investors Intelligence charges for their insights. With the exception of AAII, even the free info isn’t exactly easy to access and users earn what they end up with given the effort required to find, download, and manipulate the data into a usable format. But once the data is found, downloaded, and charts created, is a determination of extreme levels all that is involved in getting the most from this fairly sophisticated dataset? On a short-term basis, perhaps. But what if you were looking for a signal of something more substantial? What if, just perhaps, you were looking for the end to a sell-off in equities. Perhaps this sell-off endured for the entire month of May and you’re wondering if the next substantial bounce will mark the end or be just a bounce followed by lower lows.
Would a simple spike in bearish sentiment be sufficient to call a bottom? The bad news is no. The good news is it’s not much more complicated than that as long as you know what to look for. The even better news is that one of the best indicators available is probably one you’re already looking at every day!
Divergence is a tool
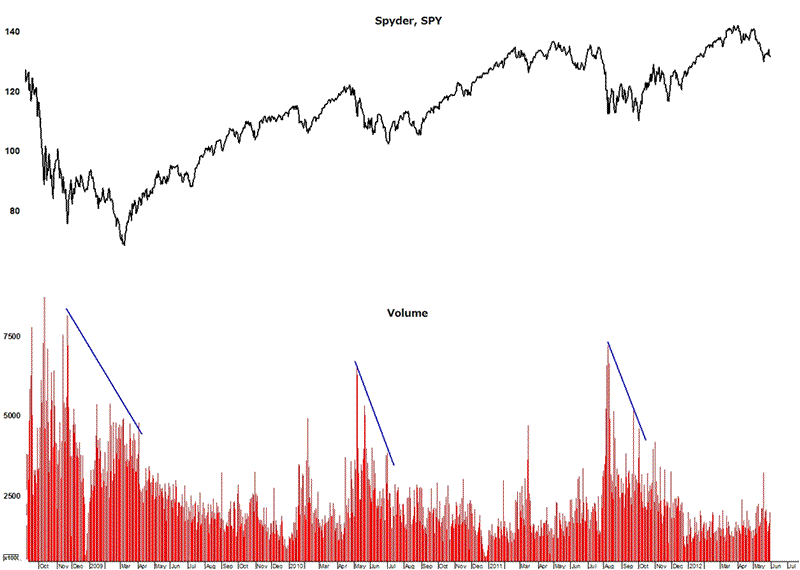
The exchange traded fund SPY represents the most widely traded and most liquid market in the world, the S&P 500. If a trader isn’t watching this index and ETF, he probably isn’t reading this article. Volume spikes typically occur at bottoms and represent a form of capitulation. But here’s what technicians know; the biggest spikes may be bottoms but rarely represent “the” bottom in a market sell-off. Final bottoms are reserved for divergences.
Divergences are an important tool in the technicians’ tool box. Divergences are looked for in all sorts of indicators; most often in the Relative Strength index. But when it comes to looking for capitulation a divergence in volume is an important signal to technicians.
Notice in the chart of the SPY below that since the 2009 low, “a” bottom was usually printed on a day that saw a spike in volume. But “the” bottom that most were looking for was found on a day on which volume spiked, but to a lower level. This is called a divergence and an important signal to look for when looking for the bottom in a market rout.

Ed Carlson, author of George Lindsay and the Art of Technical Analysis, is an independent trader, consultant, and Chartered Market Technician (CMT) based in Seattle, Washington. Carlson hosts the MTA Podcast Series: Conversations and is a contributor to Technical Analysis of Stocks and Commodities and SFO Magazines. He also manages the website Seattle Technical Advisors.com, where he publishes daily and weekly commentary. He spent twenty years as a stockbroker and holds an M.B.A. from Wichita State University.
© 2012 Copyright Ed Carlson - All Rights Reserved Disclaimer: The above is a matter of opinion provided for general information purposes only and is not intended as investment advice. Information and analysis above are derived from sources and utilising methods believed to be reliable, but we cannot accept responsibility for any losses you may incur as a result of this analysis. Individuals should consult with their personal financial advisors.
© 2005-2022 http://www.MarketOracle.co.uk - The Market Oracle is a FREE Daily Financial Markets Analysis & Forecasting online publication.


