


Energy Markets Inflation vs. Deflation Opportunities, Part3
Commodities / Energy Resources Jun 29, 2012 - 07:20 AM GMTBy: Brian_Bloom

 In the first two parts of this trilogy, we concluded that the most likely reasons for the “odd” behaviour of the gold price (which is weaker than would be expected given the chaos in Europe), and of the US Industrial Equity indices (which is not as weak as would be expected given the high levels of US unemployment and sovereign debt), were:
- The EU will probably not “disintegrate”, and even if emergency measures need to be taken, it is legally impossible for anyone other than the European Central Bank to just “print” Euros without the double entry balancing item leading to an increase in debt levels. i.e. The Sovereign Debt of any individual European country cannot just be inflated away.
- Whilst the US economy may be weak at present (real unemployment close to 20% if those who have stopped looking for work are taken into account) the frenetic activity in the natural gas industry might be looked upon as a strongly positive development. Given that “energy” drives all economic activity, and given that natural gas is likely to take over from coal and oil as the “primary” source of energy over the coming decades, the strong growth in natural gas production within the US seems likely to have flow-on effects in other industries that will emerge as a consequence. As a side benefit it will have a strongly positive impact on the US’s balance of payments
Yes, the world economy is weak and yes, it is “obvious” that the debt mountain could collapse to become a landslide that destroys the world economy in its path but, as the veteran market commentator Joseph Granville used to say (paraphrased) “If something is obvious to most investors then it is obviously wrong”. Markets do not look back, they look forward. So, what may the markets be seeing (opportunities) and, perhaps more importantly, what may they not be seeing (risks)?
****
The Opportunities
To begin with, let’s have a look at two charts of the US Dollar Index. The first, courtesy DecisionPoint.com, is shown below and a very significant chart pattern seems to be evolving, namely that of a “rounding bottom”.
Chart 1 – US Dollar Index: 1984 – 2012
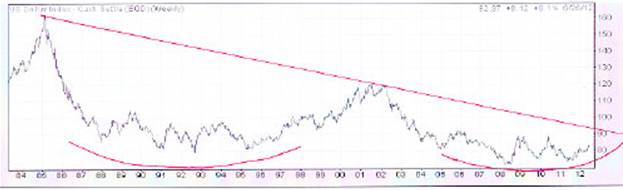
From this chart it can be seen that, if the 92 level is penetrated on the upside, a bear trend that has been in place since the 1980s will have been aborted.
What is the (technical) probability that the 92 level will be bettered?
Chart 2 – Point & Figure chart of Dollar Index
(Courtesy Stockcharts.com)
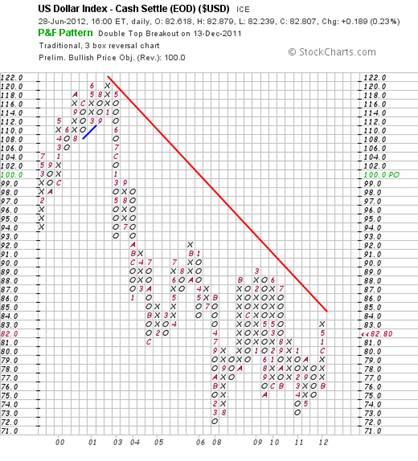
The above chart gave a buy signal on December 13th 2011, and the measured move target is 100. Clearly, if this target is met, then the financial world will be facing a whole new ballgame. The rising bottoms on this chart show that the US Dollar Index may have bottomed. In this context, the probability of 100 being reached is “high”. However, there is no way of telling how long it might take.
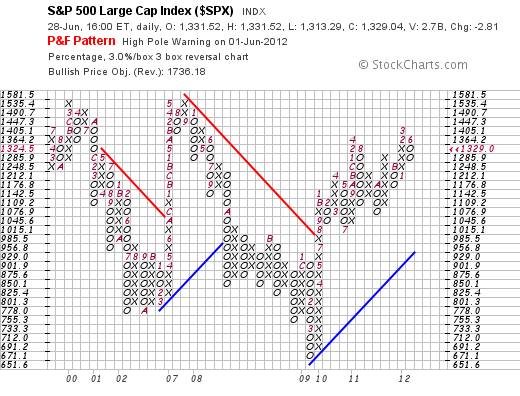
Now, before we get carried away, the pattern on the P&F chart below, of the S&P Large Cap Index, is giving off warning signs of a possible strong fall – to the region of around 900 to 1,000 – or, possibly, a 25% to 33% pullback. Whilst – if it happens – this will prove very painful for investors, it will not signal a coming burial of the US economy following a debt landslide.
Chart 3 – P&F Chart of $SPX
One reason why the fall will likely be “confined” to 25% to 33% is that the opportunities are not confined to the emerging natural gas industry and the technologies that will hang off this new energy paradigm. There are also amazing developments in nano-technology industries. One example of this is a new material called “graphene”. The reader may gain a better understanding of the nature and importance of this material by going to http://en.wikipedia.org/wiki/Graphene but one example of a potential application of this material flows from the fact that “Graphene oxide membranes have been shown to be impermeable to all gases including helium…”
Helium is even more difficult to contain than hydrogen and there are two inhibiting factors that are preventing a migration to a hydrogen based energy paradigm:
- Hydrogen is an “energy sink”. What this means is that it requires more energy to break the hydrogen/oxygen bond in a molecule of water than can be stored in the hydrogen. In time, by leveraging off the potentially extremely large “Energy Return on Energy Invested” (EROEI) from Fast Breeder nuclear reactors (25 year time horizon) and the enormous amount of “free” energy arriving from the sun, this challenge is likely to be overcome.
- Up until now, there has been no way of storing hydrogen in gaseous form because it permeates every material that seeks to contain it. Graphene has the potential to address this challenge.
Interim Conclusion
Those who are arguing that the world is running out of resources – in particular, energy resources – are clearly being excessively pessimistic. It is possible at this point in time to envisage an abundant (inexhaustible) availability of energy flowing, in sequence, from: Natural Gas, Fast Breeder Nuclear reactors, Solar Power and Hydrogen. In short, the overhang of sovereign debt may look daunting but, in reality, it is just a bump on the long term road. With an inexhaustible availability of energy – which ultimately drives economic activity – we will find a way of erecting firewalls around this sovereign debt and then managing the debt problem by a mixture of equity-for-debt swaps and debt payment out of future profits; albeit that it might take 15 to 20 years to work through the problem.
To gain some understanding of the timing of all this, the chart below – reproduced from the New Scientist Magazine of May 1985 – shows how these energy paradigms are likely to emerge:
Chart 4 – Evolution of Primary Energy Inputs since 1850
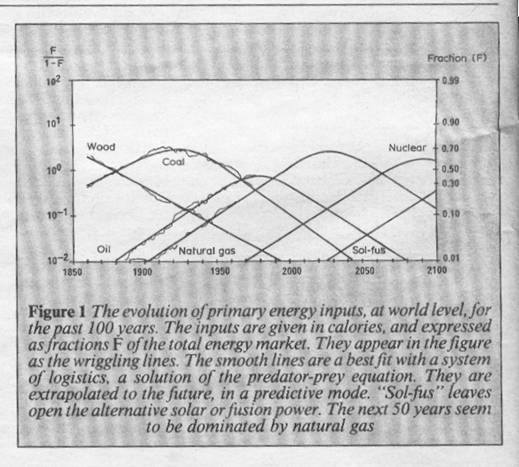
Natural Gas – which would probably have taken over from oil in the late 1990s if the US and Australia had ratified the Kyoto protocols at that time – is now coming into its own and seems likely to peak in importance in 2030. Thereafter, in around 2060, Fast Breeder nuclear seems likely to emerge as the dominant energy paradigm…., and so on. The squiggly lines are historical actual numbers and the solid lines arise from the model. The fit is so tight as to render the model eminently credible.
Author Note: The opportunities are not confined to emerging energy paradigms and/or the evolution of super materials and nano-technologies. In addition, flowing from the rapidly improving capacity to store, interrogate and manipulate data, new frontiers of knowledge are emerging in the fields of personalised medicine (that will serve to put a downward pressure on the ratio of health costs to GDP), education (individuals are able to self educate themselves in areas of their personal interest), retailing, (that will serve to put a downward pressure on rapacious profit margins of middle-men), electricity distribution (smart meters and load shedding/sharing), robotics, logistics, other…
The Risks
In summary, there appear to be three categories of risk that, if not appropriately addressed, will represent potential threats that are so serious that they have the capacity to derail all of organised society and, at the extreme, lead to its annihilation. These are:
- Population growth rate (a given) may outstrip our ability to react sufficiently quickly to a fast changing environment. (Because vested interests will very likely successfully lobby against change unless the world’s politicians become accountable to society at large).
- Climate change (and associated environmental degradation)
- Unethical behaviour on the part of society’s rich and powerful, the most powerful of which are the oil and banking lobbies.
Arguably:
- The reason we experienced the Global Financial Crisis is that the self-interested behaviour of the oil and coal lobbies “forced” a continuing reliance on these geriatric energy paradigms and there was insufficient energy available on a per capita basis to drive the world economy, and
- As a “response” to this downward pressure on economic activity, the world’s bankers – driven by reckless greed – tried to artificially stimulate the economy by loosening credit and encouraging borrowing by those who had little or no capacity to repay. What happened is that consumers lived on credit, backstopped by irresponsible governments who assumed the ultimate credit risks until it became obvious that this was an unsustainable state of affairs, and
- As a consequence of this unethical behaviour on the part of all of the oil and coal lobbies, the bankers and the politicians (by “forcing” a continuing reliance on deteriorating EROEI and high pollution fossil fuels) the ecological environment has become far more contaminated than it might have.
The key to the reader understanding the full implications of these risks is to understand – in his/her guts – the impact of a deteriorating EROEI.
What is EROEI and why is it important?
A given volume of crude oil, for example, contains a given quantity of “energy” as measured in joules or btu. The energy that can be delivered by that volume of oil (or coal or natural gas) is the “Energy Return”. But, depending on the quality of the oil (coal, gas) and the complexities of extracting it from the earth, the amount of “Energy Invested” to extract that oil will vary.
By way of example, the following is a list of energy content of various fuels:
Table 1: List showing Mega-Joules of energy per 1Kg of material
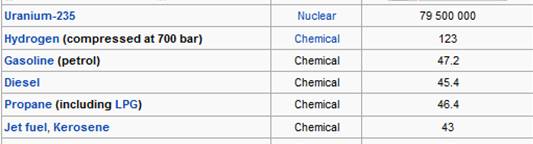
For the purposes of comparison, the following is the energy content of:
Brown Coal (lignite): 17.4 MJ/Kg
The issue on which too few (no?) politicians are focusing, can be seen from the chart below: The amount of energy that has had to be invested in oil imported into the USA has risen substantially over recent decades. As a result, the EROEI of this oil has fallen from around 40:1 in 1990 to around 19:1 in 2005, and 15:1 in 2007. The trend is clearly down.
Chart 5: Energy Return on Energy Invested – various sources of energy in the USA
Also in terms of the above chart, ethanol from sugar cane has an EROEI of around 8:1, shale oil has an EROEI of around 3:1, and ethanol from corn has an EROEI of around 1:1. None can effectively replace oil.
It becomes self evident that EROEI is a critically important ratio that needs to be measured – not from the perspective of investors (who are only interested in financial returns on investment), but from the perspective of the economy (which needs energy in sufficient quantities to function). For example, as a matter of policy, why would any government encourage/subsidise the production of ethanol from corn? It would be like digging a hole in the ground only to fill it again. Yes, an entrepreneur might work out a way of making money from establishing an ethanol-from-corn production plant – especially if government incentives could be used to augment financial returns – but, from an economic perspective, what would be the point? There would be no value-add.
So, what has been the implication of the deteriorating EROEI of oil?
The chart below, courtesy Dr Richard Duncan, originator of the Olduvai Theory, shows global energy output in barrels of oil and equivalent (boe) (line 1) global population (line 2) and global energy output per capita (line 3). For the purpose of this discussion, the forecast from 2008 might be ignored.
Chart 6: World Energy Production compared with World Population
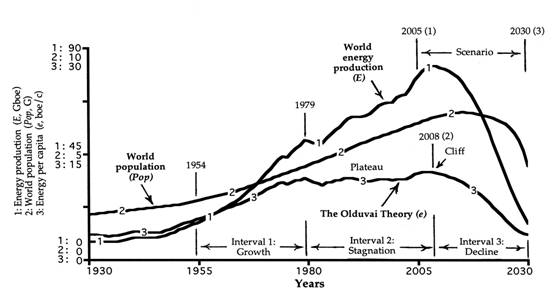
Boe includes oil, coal, natural gas, nuclear and hydro-electric and was essentially flat on a per capita basis between 1979 and 2005. In this context, this is why EROEI is so important a concept to understand: If energy output per capita has been flat and EROEI has been deteriorating, then net energy available per capita has very probably been falling.
Arguably, it was because output of the ultimate “driver” of economic activity was contracting on a per capita basis that central bankers across the planet moved to make credit more freely available (to artificially stimulate the global economy) and it was this “enjoy now pay later” mentality that gave rise to the Global Financial Crisis. Clearly, the solution to the GFC does not lie in the world of finance; it lies in the world of energy – but not just “any” energy paradigm. The paradigm/s which we should be embracing, are those which have higher (or potentially higher) EROEI’s than fossil fuels.
Importantly, when the model that gave rise to Chart 4 above was developed, climate change was not a significant issue and the world population was 4.8 million souls. Circumstances have changed.
Climate Change
A lot of noise has been made about global warming, which morphed to become “climate change” when the temperatures did not behave as expected. Those who point to the lower winter temperatures with a smug “you see, I told you!” look in their eyes, are focusing on one issue only. They are focusing on temperature today.
The cycle of a warming climate is that warming air (regardless of its cause) is also accompanied by the ocean surfaces evaporating more quickly than usual and the air becoming unusually pregnant with water vapour which, in itself, is a far more virulent greenhouse gas than CO2; and which also serves as an afterburner to the warming process. The warming accelerates. However, eventually, the concentration levels of water vapour become so high that excessive rainfall becomes inevitable (which is why the world has been experiencing floods in various geographic locations) and, in turn, this water precipitation causes cooling. It is not the temperature at any point in time that is important. It is the temperature trend. Where it will end is anyone’s guess. But let’s think it through: Logically, if the trend continues upwards (which the IPCC scientists are arguing because they believe that the CO2 warming impact will overcome and postpone the cosmologically driven Ice Age that typically follows interglacial warming periods), then more energy per capita is going to be needed to provide artificial cooling; but if the trend changes to become global cooling (which the cosmologists are arguing because they believe the CO2 argument to be spurious, and that the slowing Ocean Conveyor belt is pointing to a coming Ice Age), then more energy per capita is going to be needed to provide artificial warming. The bottom line is that it doesn’t really matter who is right, we are going to need more energy per capita than at any time in the past 11,000 years – which reinforces the critically important need to migrate to higher EROEI (than fossil fuel) energy paradigms.
Ocean Acidification
Now let’s look at what happens when the water vapour precipitates. It has already been mentioned that this serves to cool the earth’s surface. But it also causes the air in which it was once a vaporous substance to cool. Carbon Dioxide dissolves far more easily in cold water than in warm water. Therefore, another consequence of the rainfall is that the CO2 concentration level in the atmosphere reduces as it dissolves in the precipitating rainfall to form carbonic acid – which eventually finds its way to the oceans. Some sensitive animal life and plant life begins to die off and the cycle of life in the oceans is disturbed.
Where is this all leading?
If all the world’s political leaders are going to continue to ignore (argue against the negative impact of) CO2 because it doesn’t suit the agendas of the coal, oil and natural gas industries then:
- EROEI of fossil fuels will continue to deteriorate as the mining thereof becomes increasingly complex
- The economies of scale that the fossil fuel producers enjoy will block the march-to-market of alternative high cost (but potentially higher EROEI) energy paradigms and, by the time the cost structure of the fossil fuel industries rises to allow the alternative energy paradigms to compete, it will be too late, and the period from 2008 onwards in Chart 2 above will become less theoretical
- The continued reliance on fossil fuels will lead to higher CO2 levels in the atmosphere which will ether lead to:
- Global warming, if the IPCC scientists are correct or
- Acidification of the earth’s oceans if the cosmologists are correct.
(As an aside, there is insufficient space here to examine the potential benefits of producing synthetic, high EROEI, diesel from high lipid algae. It is mentioned in passing for the sake of completeness because mass production of high lipid algae will have the capacity to recycle CO2)
Importantly, the insistence of vested interests to put “spin” on the implications of their decisions/actions is unacceptably unethical. Yes, burning natural gas is much cleaner than burning coal from a CO2 perspective, but – as can be seen from the chart below (courtesy of Mr Reg Morrison, http://regmorrison.edublogs.org/category/politics/ ) “fracturing” the shale that contains the gas pockets gives rise to leakages of methane at the well head and may also give rise to methane seepages through fissures in the now fractured shale that previously contained it.
In short, fracking and burning of shale gas has a greenhouse footprint that is at least 1.2 to 2X that of mining and burning of coal. (Refer: http://www.springerlink.com/content/e384226wr4160653/fulltext.pdf?MUD=MP )
Chart 7: Carbon emissions from the full cycle of mining and burning of various fossil fuels
With the above in mind, whilst Natural Gas fracking may not be the solution that the funds’ managers believe it to be, it may facilitate a “bridge” between the current parlous state of the world economy and a more stable world economic situation over the course of the next 10 to 15 years provided more powerful (higher EROEI) and less environmentally threatening energy paradigms are brought to market. To pave the way for this outcome, the oil (now gas) companies cannot be allowed to continue influencing the thought processes of democratically elected politicians whose allegiance “should” be to the voters. If the oil companies’ global influence over our lives is not curtailed by the politicians then the earth’s climate (or ecological pollution) will spiral out of control and all life on earth might be placed at risk Therefore, the emphasis of society’s leaders in the coming 10 to 15 years should not be on growth so much as on “getting our house in order”. Debt needs to be repaid, the environment needs to be cleaned up, dinosaur legacy industries – based on fossil fuels – need to make way for more efficient “next-gen” industries and the emphasis of life on earth needs to shift from “quantity” to “quality”.
Overall Conclusion
If humanity is to survive, the time has come for the average voter to draw a line in the sand. It’s no longer about money and which investment is the smartest from a financial perspective. It’s about survival of humanity. Politicians need to be made to understand that they are ultimately accountable to the voters and not to the energy and banking industries. A new era is dawning where quality must supersede quantity.http://en.wikipedia.org/wiki/Energy_density
ibid
http://unstats.un.org/unsd/energy/yearbook/def_english_print.htm
http://www.mitenergyclub.org/assets/2008/11/15/Units_ConvFactors.MIT_EnergyClub_Factsheet.v8.pdf
http://en.wikipedia.org/wiki/File:EROI_-_Ratio_of_Energy_Returned_on_Energy_Invested_-_USA.svg
Author, Beyond Neanderthal and The Last Finesse
Beyond Neanderthal and The Last Finesse are now available to purchase in e-book format, at under US$10 a copy, via almost 60 web based book retailers across the globe. In addition to Kindle, the entertaining, easy-to-read fact based adventure novels may also be downloaded on Kindle for PC, iPhone, iPod Touch, Blackberry, Nook, iPad and Adobe Digital Editions. Together, these two books offer a holistic right brain/left brain view of the current human condition, and of possibilities for a more positive future for humanity.
Copyright © 2012 Brian Bloom - All Rights Reserved
Disclaimer: The above is a matter of opinion provided for general information purposes only and is not intended as investment advice. Information and analysis above are derived from sources and utilising methods believed to be reliable, but we cannot accept responsibility for any losses you may incur as a result of this analysis. Individuals should consult with their personal financial advisors.
Brian Bloom Archive |
© 2005-2022 http://www.MarketOracle.co.uk - The Market Oracle is a FREE Daily Financial Markets Analysis & Forecasting online publication.