Gold, Silver, Stocks and U.S. Dollar Markets Outlook
Stock-Markets / Financial Markets 2012 Aug 12, 2012 - 07:24 AM GMTBy: Chad_Bennis
 This week saw consolidation in the markets as they moved within the confines of tight ranges seeking direction. The direction has not yet been confirmed, but there are some insights we may be able to see in the technical picture that will help us understand what the markets want to do. There was a sell signal in the SP500, gold and silver that was triggered on Thursday and it was the first since August 3rd, but by the time friday morning had rolled along the market reconfirmed its bullish bias by closing higher. This behavior confirms that these markets are currently in confirmed up trends and may be setting up for higher prices. Let’s take a look at the market’s behavior.
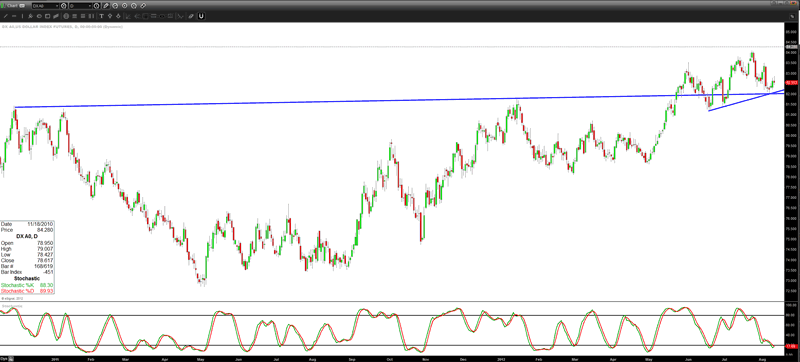
Starting with the currencies, the USDollar has been moving lower since July 25th. The dollar bounced off support at 82 on Wednesday and has been moving higher since. This has caused the equities and metals to stall at their respective resistance levels this week. The dollar is now neutral and a decision point on whether it wants to continue the downtrend in place since late July or begin another push upwards which would place pressure on stocks and commodities.
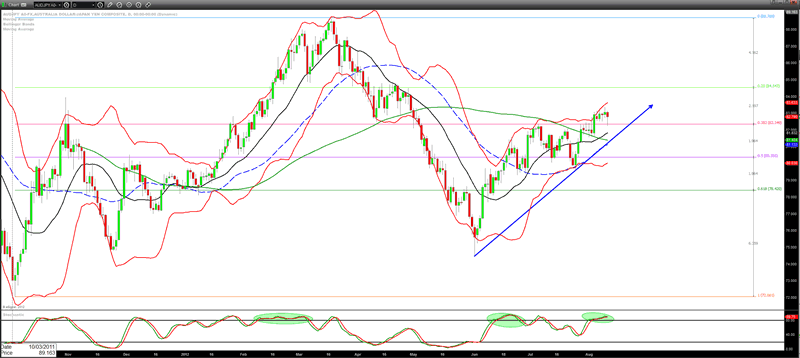
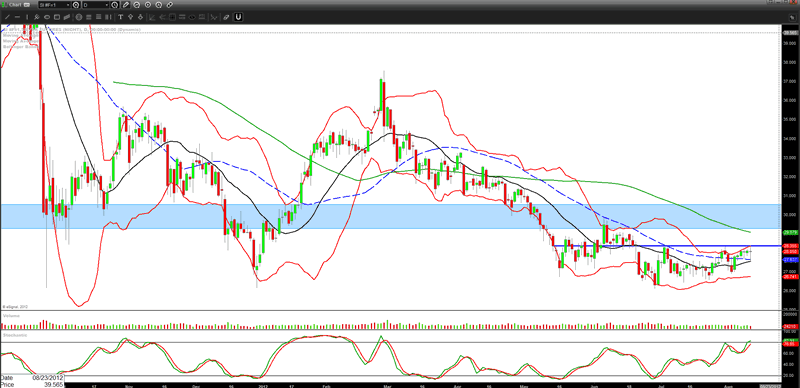
The aussie yen cross remains in an uptrend with the stochastic indicator in an embedded bullish stance(green circles). This happens when the k and d line remain over 80 for three consecutive days in a row and denotes that the uptrend will remain intact until the k line drops below 80. Any successive dips in the price action should be bought for the embedded uptrend to remain in place. This has been happening thus far since the bottom on July 25th. The chart shows the pullback on on Friday morning tested the break out level and received a bid pushing the prices higher and keeping the uptrend intact. This chart remains important as it is an indicator of what the hedge fund money is up to and right now the trend is up.
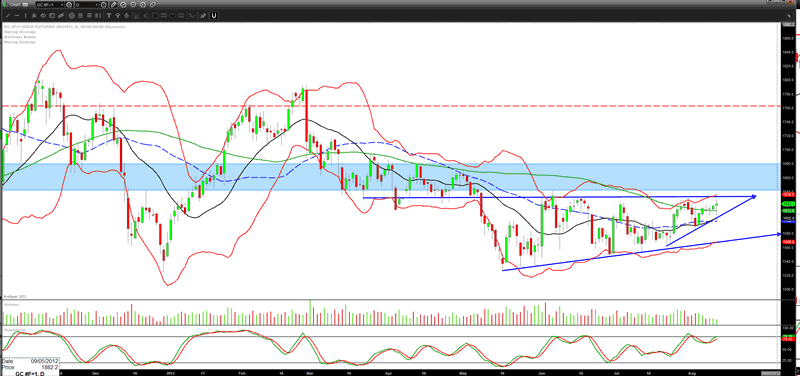
Gold pushed above the 1621 handle on Friday’s trade. The price had been capped all week at that number. Gold needs to push up and through the 1633 level with conviction to break out of the range that has been containing its price since June.
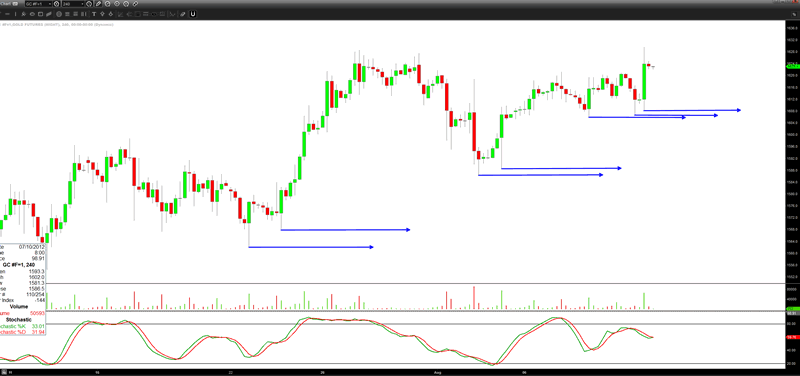
What is promising with gold is that there has been a series of higher lows as buyers have been showing up at progressively higher prices since the bottom on July 23rd. The 4 hour chart below shows the steady march higher. This action is promising and if gold breaks through the 1633 level will embolden the buyers to continue to push this market higher.
Silver continues to consolidate at higher levels, but has been held in check by the 28.35 resistance level. Silver needs to blast through this level to begin the test at major resistance between 29 -30.
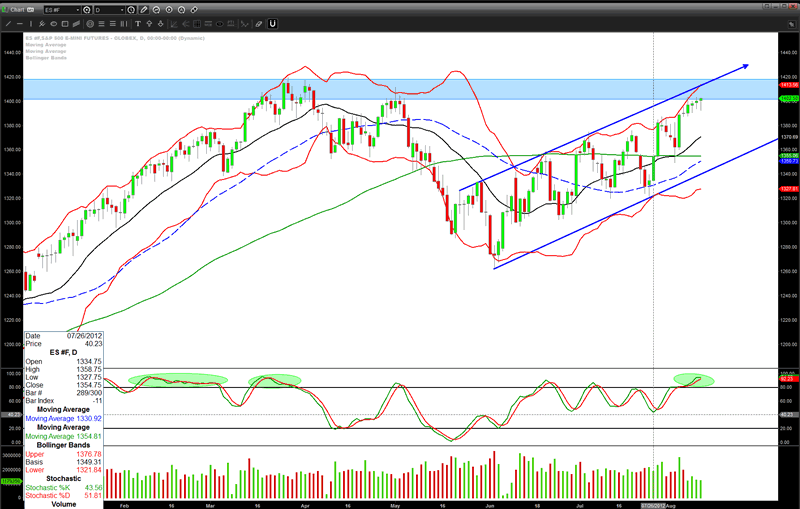
The SP500 remains in an uptrend and has locked itself into an embedded bullish stance with stochastic confirmation mentioned above. The chart action is also entering the resistance zone from the May highs and the price has been capped at the 1403 level all week. The chart needs to have the low on Friday at 1392 hold its ground and a push up and through 1403 for this action to remain strong going into next week. Volume has been weak this week which could point to two possible outcomes. Is this rally lacking conviction or are sellers no where to be found and the slow grind upwards continues? The answer will more than likely be resolved next week, but for now the confirmed uptrend is in place until the chart breaks down.
While this week’s action did not give a decisive direction going into next week, the charts of gold, SP500 and the aussie yen cross remain in an uptrend heading into Sunday night. Caution is warranted as there seems to be a lack of conviction to take these markets through their resistance last week. This coming week may provide the catalyst to become more emboldened in these trades as summer doldrums roll forward. The dollar is at a decision point and its chart needs to be monitored to determine the clues for next week’s trading.
CA Bennis
www.wheatcorncattlepigs.com
© 2012 Copyright CA Bennis - All Rights Reserved
Disclaimer: The above is a matter of opinion provided for general information purposes only and is not intended as investment advice. Information and analysis above are derived from sources and utilising methods believed to be reliable, but we cannot accept responsibility for any losses you may incur as a result of this analysis. Individuals should consult with their personal financial advisors.
© 2005-2022 http://www.MarketOracle.co.uk - The Market Oracle is a FREE Daily Financial Markets Analysis & Forecasting online publication.


