


Market Asset Class Correlations Imply Swift Selling in Coming Days
Stock-Markets / Financial Markets 2012 Dec 29, 2012 - 07:08 AM GMTBy: Tony_Pallotta

 For the week ending December 28, 2012, the SPX was down 1.9%, the Russell small caps were down 1.7% and the COMP was down 1.8%.
The model triggered short all indices in mid October. The move had not fully exhausted itself when a countertrend rally began the week of Thanksgiving. But the move was being profiled as countertrend based on the stress profile and therefore not the start of a new uptrend. That was confirmed this week when support levels failed to hold. And based on Friday's close a renewed short signal was issued for the Dow, SPX and COMP.
Only the Russell remains in a countertrend rally though TF (Russell futures) failed to hold support in extended Friday trading, thus confirming an end to is countertrend rally.
Market leader Apple (AAPL) remains in a confirmed downtrend on the weekly chart, while the daily chart is flat with a bearish bias. The monthly chart is currently failing support at 528 with next support at 475.
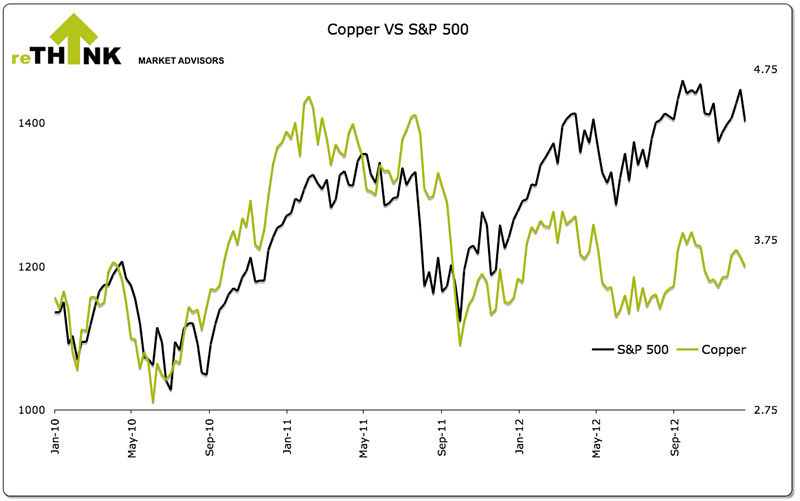
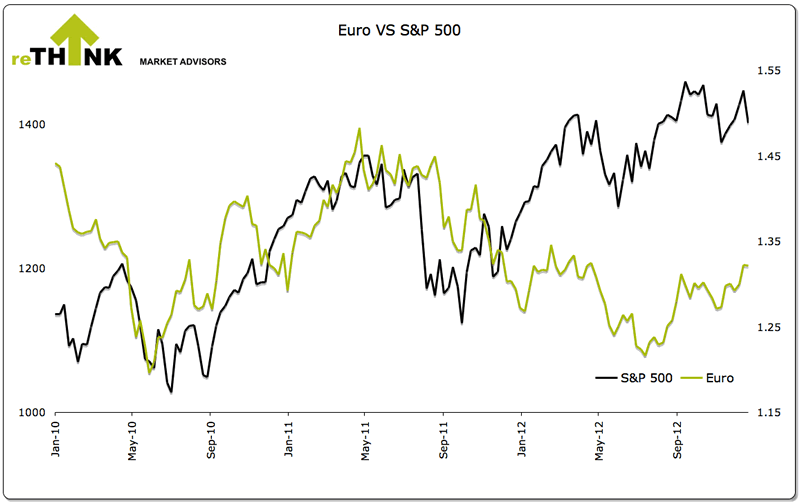
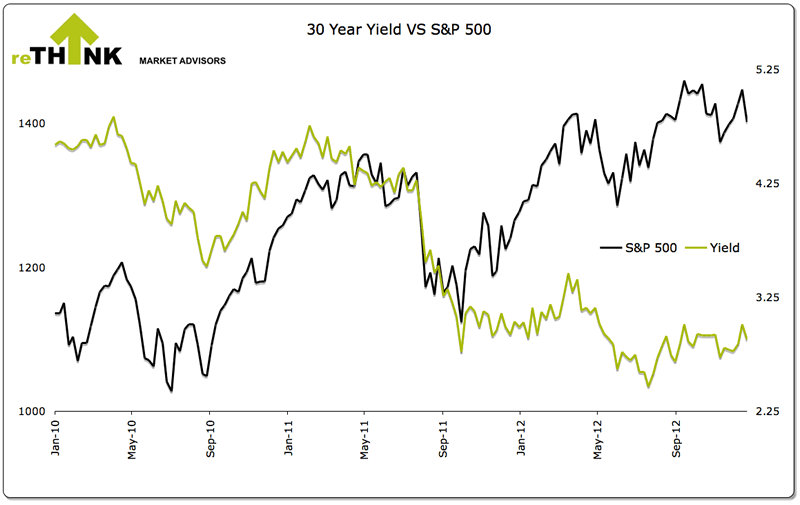
Asset Class Correlations
For the week ending December 28, 2012, the EUR was up 0.3%, copper was up 0.9%, 30 year yield was down 4bp and the Aussie Dollar was down 1.6%. The two biggest asset class headwinds facing equity markets remain copper which is very close to short on the daily chart and AUD which triggered short on the daily chart as of December 21.
The multi-month divergence with equity and the EUR, AUD, copper and 30 year yield remains. As a result equity may show greater relative weakness as part of any future asset class convergence. Therefore, using any of these asset classes as a directional indicator may likely produce false signals.
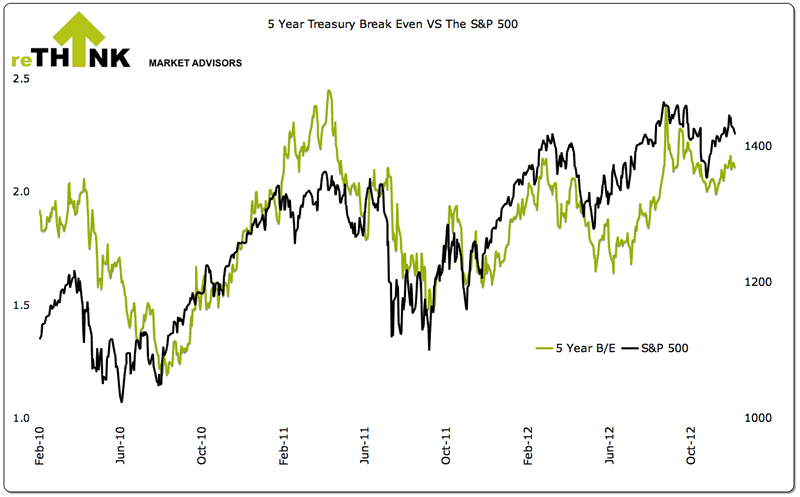
There is also a noticeable divergence with the 5 year Treasury break even as shown below.
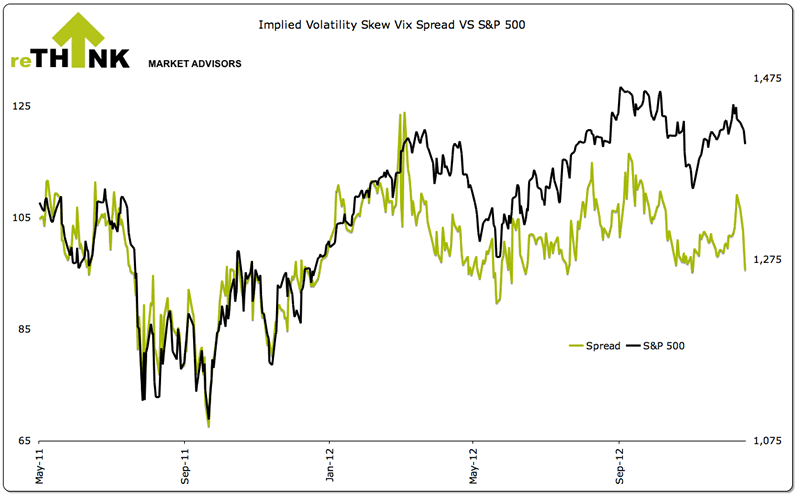
Sentiment
Market sentiment went from complacent to sending a major warning sign of impending stress within the market. On the week the vix was up 27.4% while implied volatility skews remains elevated showing a "skewed" distribution.
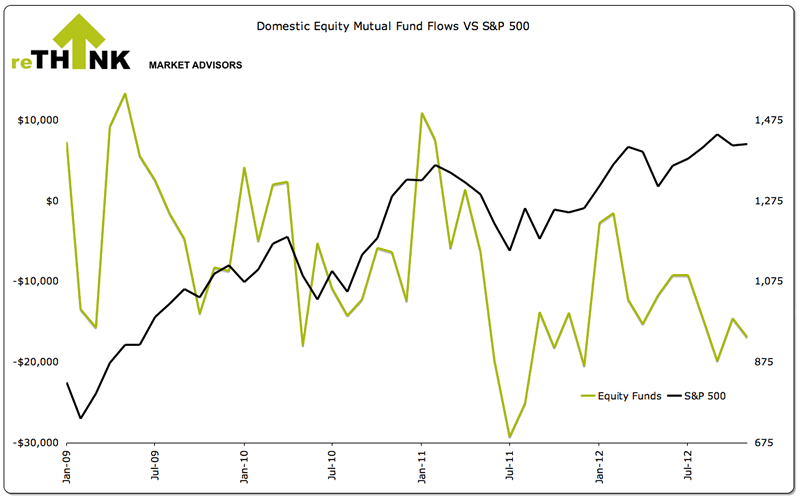
Funds Flow
For the week ending December 19, 2012 $5.2 billion flowed out of domestic equity markets while $.4 billion flowed in to both municipal and taxable bonds. A very sharp divergence exists over the past few months as domestic equity has seen a net drawdown while equity markets have moved higher.
Month to date, domestic equity funds have seen a net outflow of $18.3 billion while bond funds have seen a net inflow of $7.3 billion. Year to date, domestic equity funds have seen a net outflow of $132.5 billion while bonds funds have seen a net inflow of $295.6 billion.
Bottom Line
The multi-week counter trend rally has ended in all indices with the exception of the Russell. Large caps and tech have regained the short signal on the daily chart as of Friday's close. The momentum profile is such that the market could experience swift selling in the coming days aside from the fiscal cliff news.
About The Big Picture: All technical levels and trends are based upon Rethink Market Advisor models, which are price and momentum based. They do not use trend lines nor other traditional momentum studies. To learn more about how the models work, please click here or visit http://rethink-markets.com/model-profile
© 2012 Copyright Tony Pallotta - Disclaimer: The above is a matter of opinion provided for general information purposes only and is not intended as investment advice. Information and analysis above are derived from sources and utilising methods believed to be reliable, but we cannot accept responsibility for any losses you may incur as a result of this analysis. Individuals should consult with their personal financial advisors.
© 2005-2022 http://www.MarketOracle.co.uk - The Market Oracle is a FREE Daily Financial Markets Analysis & Forecasting online publication.