


Stocks Secular Bear Market, Slower Economic Growth Game Changer
Stock-Markets / Stocks Bear Market Jan 01, 2013 - 10:12 AM GMTBy: John_Mauldin

 We are 13 years into a secular bear market in the United States. The Nasdaq is still down 40% from its high, and the Dow and S&P 500 are essentially flat. European and Japanese equities have generally fared worse.
The average secular bear market in the US has been about 11 years, with the shortest to date being four years and the longest 20. Are we at the beginning of a new bull market or another seven years of famine? What sorts of returns should we expect over the coming years from US equities?
Even if you have no investments in the stock market, this is an important question, in part because the pensions funded by state and local governments are heavily invested in US equities. In fact, they are often projecting returns in excess of 10% per year. How likely is that to happen? Who will make up the difference if it doesn’t? In nearly all states and jurisdictions, it is against the law to change the terms of a public pension plan once it is agreed upon.
Even more important to you personally, what will happen to your taxes if the secular bear persists? On this final day of 2012, let’s take a look at the potential returns of the stock market over the next 7-10 years. In previous Thoughts from the Frontline and in my book Bull’s Eye Investing, I have written that stock market returns are a function of valuations (typically, price-to-earnings ratios). Secular bull markets are periods of rising valuations, while secular bear markets are periods of falling valuations. While stock market returns can vary widely over one-year, ten-year, or twenty-year periods, over the long term stock market earnings have tended to correlate very highly with GDP and inflation.
Since GDP has tended to grow (at least until recently) at 3% per year, predicting long-term returns and secular bull and bear markets has been pretty straightforward. But recently several noteworthy analysts have presented research suggesting that GDP will not grow anywhere close to 3% over the coming decades. In today’s letter we look at the ramifications of slower GDP growth on equity returns. For most investors this is a very important topic, as the stock market tends to be the main driver of their investment returns.
So Who’s the Optimist Now?
At the beginning of the last decade I wrote that the US economy would be lucky to grow at 2% for the entire decade. Even though I was called a “big bad bear” at the time, it turns out that I was an optimist. The economy grew at 1.7%. When asked about the present decade a few years ago, I cautiously said that we would be lucky to grow at 2% for the decade, which elicited more bearish name-calling. Now I once again find myself to be more optimistic than some of my colleagues.
Last summer Bill Gross (chief investment officer of PIMCO) forecast that the US economy would grow at only 1.5% over the next decade. Recently, Jeremy Grantham of GMO (one of my investment heroes) wrote a paper called On the Road to Zero Growth, in which he forecast that “Going forward, GDP growth (conventionally measured) for the U.S. is likely to be about only 1.4% a year, and adjusted growth about 0.9%.”
Adding further to the sentiment, Dr. Robert Gordon, a very respected economist, wrote a paper for the National Bureau of Economic Research provocatively titled Is U.S. Economic Growth Over? Faltering Innovation Confronts the Six Headwinds. Quoting from the abstract:
Even if innovation were to continue into the future at the rate of the two decades before 2007, the U.S. faces six headwinds that are in the process of dragging long-term growth to half or less of the 1.9 percent annual rate experienced between 1860 and 2007. These include demography, education, inequality, globalization, energy/environment, and the overhang of consumer and government debt. A provocative “exercise in subtraction” suggests that future growth in consumption per capita for the bottom 99 percent of the income distribution could fall below 0.5 percent per year for an extended period of decades.”
Even if Gordon does measure growth somewhat unconventionally, his is a very sobering forecast.
Finally, we have a paper called 1%... The New Normal Growth Rate? Authored by Chris Brightman of Research Affiliates (the firm founded by my friend Rob Arnott), it presents their view that 1% is the “new normal” growth rate. Chris follows up on research presented earlier, in which they described what they call the “3-D Hurricane” of deficits, debt, and demography.
My good friend (and no stranger to longtime readers of this letter) Ed Easterling of Crestmont Research (full bio at the end of this letter) and I were recently discussing these forecasts, finding humor in the fact that Grantham and Brightman, et al. were essentially calling Gross an optimist. But we definitely did not find anything funny about the implications of their forecasts on long-term stock market returns. We thereupon agreed to coauthor this letter, with the intention of helping you make your investment plans for the coming year. As we have done in the past, Ed wrote the first draft and I threw in a little editing and commenting, trying not to diminish the value of his research. And with that setup, let’s jump right in. (Note: All graphs and charts are his.)
Game-Changer: Slower Economic Growth
As noted above, the longer-term assessments for GDP growth are turning decidedly lower than the long-term 3% we saw over the last century. Our purpose in this letter is to look beyond the details of each argument as to the prospects for growth. That is, our objective is to understand the long-term implications of growth for stock market returns. Whether your favorite economist foresees 2%, 1%, or 0% long-term growth, the outcome for returns is similar in direction: the impact will lie somewhere between bad and worse.
The following discussion includes excerpts from Ed’s book Probable Outcomes (and it’s one I highly recommend – John). It explores the possibility that future real economic growth may have downshifted from its historical trend of 3% – and more significantly, it highlights the implications of that shift.
Historically, the prospect of slower economic growth has not often been considered by economists and analysts, but it now looms large in mainstream thinking. The effects of slower growth on stock market returns will be dramatic for investors.
Shifts & Cycles
Most investors recognize that the stock market delivers extended periods of above-average and below-average returns. These periods are known as secular stock-market cycles. The last full secular bear was 1966-1981. The most recent secular bull ran from 1982-1999. Our current secular bear market started in 2000, and it still has a long way to go. Figure 1 presents all secular stock market periods since 1900.
Figure 1. Secular Stock Market Cycles
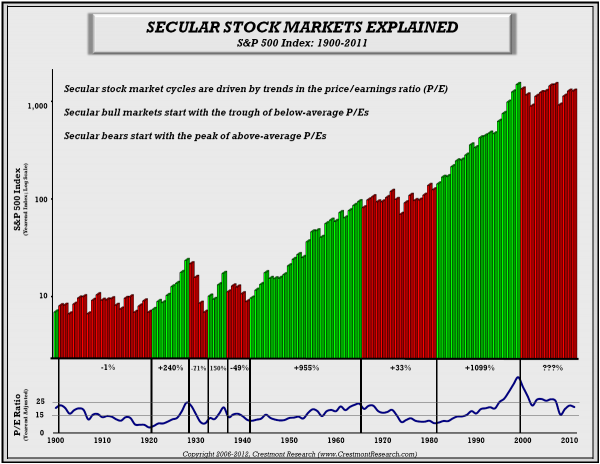
These secular periods are not the result of a random walk through good times and bad times. They are not periods of war or peace. They are not even alternating periods of recession and expansion in the economy. Rather, secular stock-market cycles are driven by changes in the overall value of the market. In other words, secular bull markets are periods when the price/earnings ratio (P/E) of the market rises and compounds returns, while secular bear markets are periods when P/E declines and compromises returns. The blue line near the bottom of Figure 1 shows the history of P/E. Rising P/E drives secular bulls (green-bar periods), and declining P/E drives secular bears (red-bar periods).
Most important, the P/E cycle is not a coincidental wave nor a random walk. P/E is driven by the trend and level of the inflation rate. Higher inflation drives interest rates upward. Investors demand higher returns to offset the adverse impact of inflation. Thus, higher inflation drives P/E lower, so stock-market investors can achieve higher returns from lower prices and higher dividend yields.
Deflation also drives P/E lower. That occurs in response to an expected future of declining nominal earnings and dividends. And declining nominal cash flows during deflation drives current values lower.
Therefore, for more than a century, stock-market investors have endured secular stock-market cycles driven by the inflation-rate cycle. But there is a second variable that determines stock-market valuation. Until recently, that variable could be ignored because it was accepted as a constant. Over the decades, this second variable has seemed to crawl along like the notorious tortoise.
The second variable impacting stock-market value is the growth rate of earnings. Investors know that high-growth companies have higher P/Es than slower-growing, mature companies. The same principle applies to the market overall. It is especially relevant now that the constant of economic growth is uncertain.
During the past century, real economic growth increased at an average of slightly more than 3% annually. As a result of the strong relationship between earnings and the economy, earnings per share (EPS) for the major stock market indexes also increased at near 3% in real terms.
(This makes sense, because how can very broad market indexes grow any faster than the overall economy? Individual companies and industries can, of course, grow faster or slower; but the average is highly correlated with GDP growth plus inflation. – John)
P/E generally peaked in the mid-20s (except during the Great Bubble of the late 1990s) and troughed below 10. The outside range for P/E, as well as its midpoint average near 15.5, occurred with such consistency because the growth rates of both the economy and earnings were so consistent over the long term, at close to 3%.
In effect, the growth rate determines the P/E range and midpoint, and the inflation rate determines the location and trend within the range. A change in growth rate causes a shift in the range. These two dynamics are illustrated in Figure 2.
Figure 2. Impact of Growth Rate and Inflation Rate on P/E
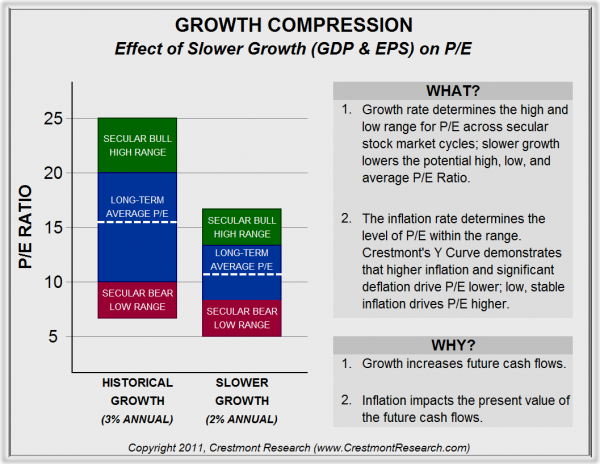
One effect of slower economic and earnings growth will be a lower level of earnings in the future. For example, over ten years, $1.00 compounds to $1.34 at 3%, but to only $1.22 at 2%. The difference is about 9.3% less EPS for the stock market under the slower growth scenario. Many analysts would consider that level of variance a minor forecasting error for EPS over a decade. Whether the stock market is 9% higher or lower in a decade is generally small change in the context of overall returns. But the implication of slower growth is far more significant than simply the ending level of earnings – slower growth is a game-changer.
There are three ways to assess the effects of slower growth, all of which provide similar results. First, an extremely long-term model of earnings growth, dividend payouts, and present value can be constructed to assess the impact of changes in growth on P/E. Second, academic formulas can be employed to derive the effects on P/E based upon perpetual dividend growth. Third, the impact on P/E can be evaluated through the components of stock-market returns. Since all three approaches reflect comparable results, the more pragmatic third approach will be used here to explore the implications.
Before examining the details, consider the significance of the issue. If the future growth rate of earnings decreases by 1% (i.e., near the reduction that would be expected if economic growth decreases by 1%), the historical average for P/E would decline from 15.5 to 11.5 –amounting to a 26% decline in the stock market beyond the 9% shortfall from lower earnings growth. Even more dramatically, the typical peak in P/E would fall from the low to mid 20s to the mid-teens – the adverse impact of slower growth increases at higher levels of P/E. (This is explained in further detail below.)
As discussed above, inflation causes P/E to decrease because investors demand higher returns in compensation. Unlike the inflation rate, though, the growth rate of earnings does not necessarily change the return level that investors expect. They will still expect returns that are commensurate with the stock market and the expected inflation rate, but they will look to replace the contribution of slower earnings growth with another source of return.
To illustrate, assuming that a change in the growth rate does not change the inflation rate, the yields on government bonds can be expected to remain the same. Absent a change in credit quality from slower growth, the risk premium for corporate bond yields will not change. Likewise, the expected return from stock-market investments can be expected to remain unchanged due to the growth rate.
When slower growth reduces the contribution of earnings growth to total return, another source of return is therefore needed to make up the shortfall. Stock-market investors are not willing to take equity risk without appropriate equity returns. If bond yields do not change, they will not compromise stock-market returns. In this situation, stock-market investors will step away until the price of the market declines until it again provides adequate returns. This is the function of markets: finding the price that provides a fair return.
This discussion relates to the effect from changes in the growth rate of earnings. To isolate that factor, several assumptions are needed, basically providing that the relevant relationships remain the same. First, based upon the previous economics discussion, a downshift in economic growth drives slower earnings growth. Second, long-term profit margins remain similar under both growth scenarios; thus the slowing of earnings growth is consistent with the downshift in economic growth. Third, the inflation rate remains constant across both scenarios for growth. Fourth, the expected return for stocks and bonds as well as the related equity risk premium for stocks does not change across both scenarios for growth. In other words, the relevant relationships remain constant.
Of the three components of stock-market returns, two are available as sources of return, and the third one represents the way in which returns occur. The first source of return, EPS growth, is defined in this example as providing either 3% or 2% toward to the total return (“Historical Growth” and “Slower Growth” bars in Figure 2). As a result, the second source of return, dividend yield, will need to increase to compensate for lower earnings growth in the slower-growth scenario. Herein lies the role of the third source of stock-market returns: changes in P/E.
The dividend yield rises as P/E declines, and vice versa. For the stock market to be positioned to provide equity-level returns, investors will look for the lower price that enables the dividend yield to rise sufficiently to offset the loss of earnings growth. The required decline in P/E varies based upon the starting level of P/E.
If P/E starts relatively high, then a higher decline is required to provide the required dividend yield increase. For example, if EPS growth drops by 1%, then the change in P/E required to increase the dividend yield by 1% is 7 points (from 22 to 15), 4 points (from 15.5 to 11.5), and 2 points (from 10 to 8).
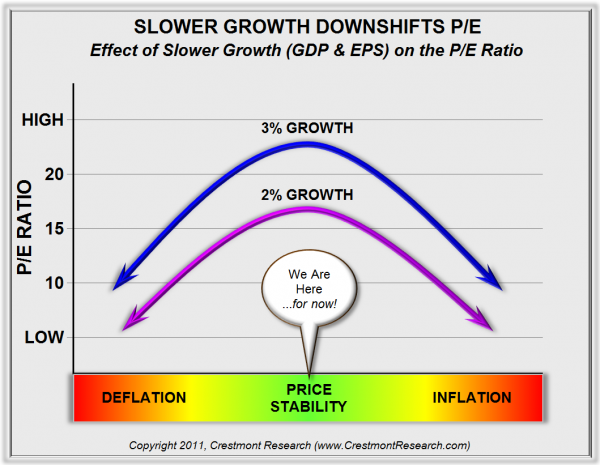
This shift in P/E relates only to the change in earnings growth. P/E would then be further affected by changes in the inflation rate. Figure 3 provides another graphic illustration of the dynamics of the shift and growth cycles. The shift is related to changes in growth rate, and the cycle is driven by inflation-rate trends and levels.
Figure 3. Impact of Growth Rate and Inflation Rate on P/E
As previously mentioned, the two other methodologies provide similar results. A change in the forecast for future earnings due to slower growth results in lower present values. Likewise, the reduction in the growth-rate variable in traditional academic models also produces lower current values.
Well, what about Bill Gross’ future of 1.5% growth, Chris Brightman’s outlook for 1% growth, and Jeremy Grantham’s ultimate rate of 0.4% growth? Two-percent growth downshifts the future average P/E from 15.5 to 11.5. If that is not concerning enough, note that a one-percent growth rate resets the long-term average P/E to near 9.
At this point in time, there is a significant disconnect between the market’s expectation of future growth and the vision of these notable sages. P/E, normalized for the business cycle, is near 20. That is consistent with the current low inflation rate and historical average growth rates. Should it become apparent that either factor might change, beware the adverse impact of another P/E cycle, a new era with P/E shifting downward, or the compounded effects of both concurrently.
There will likely be, and needs to be, much debate about the accuracy of the estimates presented above, and about nuances that could add decimal points to the factors or adjust the effects based upon further scenario assumptions. However, whether using long-term models, academic formulas, or the component-based method, all three approaches provide similar results. It is therefore important to recognize that slower growth will have a significant impact on P/E at all levels of the inflation rate. As the discussion evolves into implications and probable outcomes over this decade, slower economic and earnings growth will have a direct effect on the P/E range.
We are frequently asked how we expect lower valuations to manifest themselves. The single-digit P/E ratios that are typical of the end of a secular bear market and the beginning of a secular bull market would mean either a significant drop in the current valuation of the stock market or a prolonged sideways market. A general awareness and acceptance of a slower-growth economy would certainly help bring about lower valuations.
Somewhere Over the Rainbow
Investors are confronting the reality of the current secular bear market, which is both a consequence of the previous secular bull market and a precursor to the next secular bull. The duration of the current secular bear period is uncertain. Should higher inflation or deflation overcome the currently rather stable inflation regime in the near term, this secular bear could end sooner, as that would drive valuations down. That outcome, however, would cause significant losses to stock market portfolios. If, however, inflation or deflation slowly creeps into the economy – over the next decade, for example – then this secular bear will be one of the longer ones. However, if this decade repeats the relatively low inflation of the past decade, then the secular bear may linger longer than any of us would like.
Beyond the inflation rate, economic growth will also have an impact on the future of this secular bear. Following last decade’s below-average economic growth, if we are to return to the 3% historic growth trend, then this decade must soon start to generate above-average growth to offset the recent shortfall. The result would be a solid boost to earnings in this decade. However, economic growth could also have downshifted during the last decade to a lower level that will persist for the foreseeable future. The result would be a significantly lower range of P/Es, but not necessarily a progression through and out of the secular bear market. The economic growth rate can shift P/E upward or downward, but only inflation or deflation can kill a secular bear.
Whether this secular bear cycle ends in five years, ten years, or beyond, the ultimate outcome will be the start of the next secular bull market, which will bring an extended period of above-average returns. Spring will finally have sprung. There is a rainbow out there somewhere. This longer-term view of secular stock market cycles lets us look out across this secular bear to the next secular bull. The operative word is “across” this secular bear and not past it.
“Across” recognizes the reality of the risks and opportunities presented by the secular bear in whose grip we find ourselves. “Past” suggests the ostrich-like approach of ignoring reality in the blind hope of an unrealistic outcome. “Across” is enabling, while “past” is disabling.
For investors who are accumulating for the future, secular bear markets are times to build savings for later investment. This is done not only through contributions but also through prudent investing by means of an absolute-return approach. The absolute-return approach uses the dual strategy of risk management and investment selection.
Investment portfolios should be diversified across a range of investments that are diligently selected and actively managed, especially ones that control risk and enhance return. Investors should not avoid the stock market nor bond market altogether. Instead, their objective should be to seek, in both markets, investments that incorporate elements of skill to enhance returns. Secular bear markets are not periods during which to avoid investing; they are periods that demand an adjustment to investment strategy as well as to expectations regarding what potential returns can be.
For investors in pension funds and retirees who are more dependent on their current assets, early recognition is key to the investment strategy. The principles of absolute-return investing are important for preserving capital and generating much-needed returns; but it is potentially even more important for these investors to manage their assumptions and expectations. Recognizing secular-bear market conditions earlier enables investors to make potentially painful adjustments more easily and with less damage. Delaying action until crisis has onset generally brings adverse consequences! Hoping that the next secular bull market will arrive quickly is not a prudent way to address shortfalls. The longer it takes you to adjust expectations, the greater the gap to you will have to fill and the shorter the time you will have to fill it.
This strategy applies most of all to those entrusted with the management of pensions, both private and public. The largest fraction of the monies a pension fund will pay out in the future is expected to come from investment growth. At the beginning of the last decade, pension funds were routinely expecting to get 8% or higher returns on their investment portfolios. Those projections have proved a dismal illusion. Yet pension funds continue to anticipate 7-8% returns going forward. The very people who should know best that past performance is not indicative of future results are expecting the stock market to return to past performance to give them their longed-for results.
These pension-fund shortfalls will mean higher required contributions from corporations. More important, and urgently, they also mean higher required funding for public pensions from taxpayers, accompanied by a reduction of promised benefits. We do not see how the state of Illinois, for example, can meet its obligations without a significant restructuring of its pension plans or its budget, or more likely both. While those receiving pensions would prefer higher taxes on those funding them, there is a limit to what taxpayers will bear.
Sadly, we’re going to find that this is not just an Illinois problem, but one that will become apparent in states, cities, and counties all across the country. This is going to cause a great deal of distress for everyone concerned.
Finally, a comment on GDP growth. The downbeat forecasts mentioned at the beginning of the letter are all based on different methodologies, and we will venture one further argument. It is highly likely that taxes are going to increase over the next few years, and not just due to the current “fiscal cliff” issue. No matter which path is chosen in the short term, it seems improbable that a true resolution to the total deficit issue will be accomplished. More deficit-reduction work will be needed. That means spending cuts, accompanied by yet more tax increases.
However you view the prospect of increased taxes, there is no way to get around the fact that they will reduce general savings. If you reduce savings you reduce the capital available for investment in current and future businesses. If you reduce capital formation, you’re going to reduce future growth. The current fetish among the economic thought leaders is that consumption is the driver of GDP growth. But GDP growth is ultimately a reflection of increases in population and productivity. And if you want to increase productivity, you must increase capital available for investment.
Note that this is a circular argument. If we increase taxes, we reduce the potential for GDP growth by reducing the capital available for investment, which of course makes the rosy growth projections of government forecasters fall short, thus driving future deficits even higher, minus further deficit-reduction efforts. As Chris Brightman writes:
The most important determinant of our productivity per person is the amount of capital we have available for investment, and wise use of that capital. Investing to improve productivity in all of its forms, from machine tools, to transportation infrastructure, to education, can all raise our productivity. Investing requires savings, and we have been saving far too little. To increase productivity requires that we reorient our economy away from debt-financed consumption and toward saving-financed investment.
The politicians in Washington all give lip service to the need for growth. But then they turn around and do the very things that make it more difficult for the economy to grow. And as we have seen, this is going to make it more difficult for the stock market to return to a secular bull path. Which will create a greater need for higher taxes and/or reduced spending on the state and local levels. Which of course hurts GDP growth.
We are coming to the Endgame. There are no easy solutions, only very difficult ones. And none of them bode well for future equity valuations.
John here: I can tell you that there is deep concern when Ed and I talk about the consequences of government actions and potentially slow GDP growth for the average investor. All too few people understand the links between government decisions and their retirement portfolios. If you are reading this letter, you are one of those few. You do have options, but there are no easy options any more.
For those interested in cycles I suggest you take a close look at Ed’s books, Unexpected Returns and Probable Outcomes, and his excellent website, www.Crestmontresearch.com. It is a treasure trove of knowledge. At the beginning of each year, Ed updates most of the website’s charts and graphs, many of which were included in one or both of his books.
I also recently wrote a paper along these lines, published by my partners at Altegris, on its home page (to access it, first you must indicate what type of investor you are). My paper focuses on managed futures, and you’ll find other papers on alternative investments, along with a lot of worthwhile research Altegris has done. “Alternative investing” is increasingly a part of accepted investing methodology. In my opinion, alternatives should be defined broadly to mean not sitting back and depending on “buy and hope” (otherwise known as buy and hold) equity indexes. We will have reason to explore this topic further in the coming year!
Santa Barbara, Europe, Toronto, and Christmas Just Past
You will likely be getting this letter on New Year’s Eve. Let me wish you a very happy and prosperous new year. I’m going to begin the new year by flying to Santa Barbara to be with my friend and partner Jon Sundt of Altegris Investments at his home up at the Hollister Ranch. While we will spend some time, as we always do, talking about alternative investments and ways to make them more readily available to investors, I will spend the bulk of my time thinking about my annual forecast letter, which I will write this coming weekend. I spend more time researching this one letter than anything else I write, and this year will be no different.
I’ll fly back on Saturday and then leave Sunday afternoon for Europe. I’ll be there for over two weeks. The first portion of the trip, I will be in Scandinavia on a speaking tour for Skagen Funds. I am finalizing details for the remaining time, but I intend to go to Greece and then make a quick stop in Geneva. I really want to experience Greece firsthand, rather than just through the eyes of other writers.
I will fly to Toronto on Sunday, January 27 to spend some time with my friend David Rosenberg. He has recently returned from Jerusalem (or, as he wrote me, “Yerushalayim”), where he celebrated the bar mitzvah of his youngest son, Mikey. Mazel tov, young man. Then I’ll meet with my longtime friend and natural-resource maven Rick Rule and the team at Sprott Asset Management. And that evening I’ll do a speech for my Canadian partner, John Nicola of Nicola Wealth Management. (If you are interested in attending the speech, drop me a note and I will send it on to John N.) From Toronto, I’ll probably move on to New York and DC.
Let me suggest that you spend a few moments with this most-excellent, if somewhat sad, video of the music of the great artists who graced our lives and passed away this year. I admit to having played it a few times. Thanks to each of them for the memories.
My daughter Amanda took it upon herself to decorate my home for Christmas this year. We went out and bought a tree right after Thanksgiving, and then she took over. I must admit, it was more festive in the house than I remember it ever being. And the tree was quite fragrant. Also, the family was around more, for whatever reason. They just seemed to want to be together more this year. It was a great time and I enjoyed being home with the kids and grandkids and having some time off from the road.
Yesterday, Amanda also ended up with the task of putting everything away. She up to my office, where I was, as usual, reading and writing. She had a sad look on her face. “Dad, I hate putting up the Christmas stuff. It’s so sad.”
I made some lame comment about time passing and how much fun it had been and how she had made the house so beautiful. And then I looked in her eyes. I did not see what I expected; there were tears there. “I really don’t like for Christmas to be over. It’s my favorite time of the year.” I hugged her, and then I’m sure I made another lame Dad comment about how next year she will have a baby (due in early April) to celebrate Christmas with.
I miss it too, Amanda. Time passes so quickly, and those moments when we are together are the ones that I treasure most. They are all too few, and then they’re gone, and there’s just a Christmas tree lying forlornly out in the alley. Except that we still have the memories. And this year I have the special memory of Amanda and those tears. I will never forget it. And I think when I see my mother tomorrow I will ask her too about some Christmases past. I bet that at 95 she can still remind me of a few special moments I have forgotten.
Have a great week. Thanks for spending yet another year with me. And I look forward to 2013 being the best and most interesting one ever.
Your thinking a lot about the future (and our kids) analyst,
John Mauldin
Note: Ed Easterling is the author of the recently released Probable Outcomes: Secular Stock Market Insights and the award-winning Unexpected Returns: Understanding Secular Stock Market Cycles. He is president of an investment management and research firm and a senior fellow with the Alternative Investment Center at SMU’s Cox School of Business, where he previously served on the adjunct faculty and taught the course on alternative investments and hedge funds for MBA students. Ed publishes provocative research and graphical analyses on the financial markets at www.CrestmontResearch.com.
John Mauldin
subscribers@MauldinEconomics.com
Outside the Box is a free weekly economic e-letter by best-selling author and renowned financial expert, John Mauldin. You can learn more and get your free subscription by visiting www.JohnMauldin.com.
Please write to johnmauldin@2000wave.com to inform us of any reproductions, including when and where copy will be reproduced. You must keep the letter intact, from introduction to disclaimers. If you would like to quote brief portions only, please reference www.JohnMauldin.com.
John Mauldin, Best-Selling author and recognized financial expert, is also editor of the free Thoughts From the Frontline that goes to over 1 million readers each week. For more information on John or his FREE weekly economic letter go to: http://www.frontlinethoughts.com/
To subscribe to John Mauldin's E-Letter please click here:http://www.frontlinethoughts.com/subscribe.asp
Copyright 2012 John Mauldin. All Rights Reserved
Note: John Mauldin is the President of Millennium Wave Advisors, LLC (MWA), which is an investment advisory firm registered with multiple states. John Mauldin is a registered representative of Millennium Wave Securities, LLC, (MWS), an FINRA registered broker-dealer. MWS is also a Commodity Pool Operator (CPO) and a Commodity Trading Advisor (CTA) registered with the CFTC, as well as an Introducing Broker (IB). Millennium Wave Investments is a dba of MWA LLC and MWS LLC. Millennium Wave Investments cooperates in the consulting on and marketing of private investment offerings with other independent firms such as Altegris Investments; Absolute Return Partners, LLP; Plexus Asset Management; Fynn Capital; and Nicola Wealth Management. Funds recommended by Mauldin may pay a portion of their fees to these independent firms, who will share 1/3 of those fees with MWS and thus with Mauldin. Any views expressed herein are provided for information purposes only and should not be construed in any way as an offer, an endorsement, or inducement to invest with any CTA, fund, or program mentioned here or elsewhere. Before seeking any advisor's services or making an investment in a fund, investors must read and examine thoroughly the respective disclosure document or offering memorandum. Since these firms and Mauldin receive fees from the funds they recommend/market, they only recommend/market products with which they have been able to negotiate fee arrangements.
Opinions expressed in these reports may change without prior notice. John Mauldin and/or the staffs at Millennium Wave Advisors, LLC and InvestorsInsight Publishing, Inc. ("InvestorsInsight") may or may not have investments in any funds cited above.
Disclaimer PAST RESULTS ARE NOT INDICATIVE OF FUTURE RESULTS. THERE IS RISK OF LOSS AS WELL AS THE OPPORTUNITY FOR GAIN WHEN INVESTING IN MANAGED FUNDS. WHEN CONSIDERING ALTERNATIVE INVESTMENTS, INCLUDING HEDGE FUNDS, YOU SHOULD CONSIDER VARIOUS RISKS INCLUDING THE FACT THAT SOME PRODUCTS: OFTEN ENGAGE IN LEVERAGING AND OTHER SPECULATIVE INVESTMENT PRACTICES THAT MAY INCREASE THE RISK OF INVESTMENT LOSS, CAN BE ILLIQUID, ARE NOT REQUIRED TO PROVIDE PERIODIC PRICING OR VALUATION INFORMATION TO INVESTORS, MAY INVOLVE COMPLEX TAX STRUCTURES AND DELAYS IN DISTRIBUTING IMPORTANT TAX INFORMATION, ARE NOT SUBJECT TO THE SAME REGULATORY REQUIREMENTS AS MUTUAL FUNDS, OFTEN CHARGE HIGH FEES, AND IN MANY CASES THE UNDERLYING INVESTMENTS ARE NOT TRANSPARENT AND ARE KNOWN ONLY TO THE INVESTMENT MANAGER.
John Mauldin Archive |
© 2005-2022 http://www.MarketOracle.co.uk - The Market Oracle is a FREE Daily Financial Markets Analysis & Forecasting online publication.