


Markets Awaiting Test of Support in Determining Future Direction
Stock-Markets / Financial Markets 2013 Jan 12, 2013 - 09:17 AM GMTBy: Tony_Pallotta

 For the week ending January 11, 2013, the SPX was up 0.4%, the Russell small caps were up .2% and the COMP was up 0.8%.
We remain waiting for a test of model support in determining future market direction. Support can be tested in one of two ways, through a pullback or sideways price consolidation. Whichever method the market chooses, support will be tested. And it is at that test of support where the market will show whether a long will trigger or resumption of the previous downtrend.
There are either buyers or there are not. It's really that simple. There is no sense trying to speculate beyond that test. It will come. We just need to be patient waiting for confirmation. It is worth noting the weakness in the Russell the latter part of the week as compared to large caps. This increases the probability of a pullback into support versus a sideways test.
Support for next week is roughly 1448-1452 on SPX, 861-865 on RUT and 3065-3085 on COMP.
We continue to profile USD/JPY as an exhaustive move, though there may still be another thrust higher. Support is roughly 86 per the daily chart. Failure to hold support sets up a probable move to 82-84 per the weekly and monthly charts. A pullback in this currency pair will pressure Treasury yield lower as well as risk in general.
Asset Class Correlations
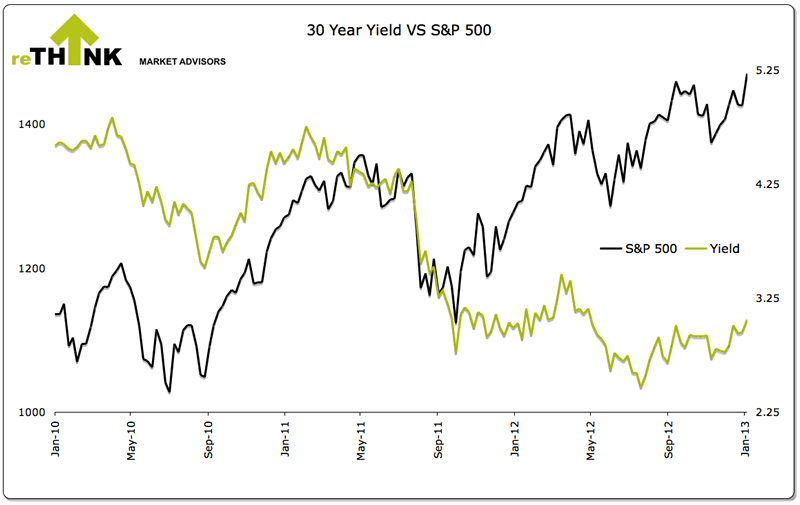
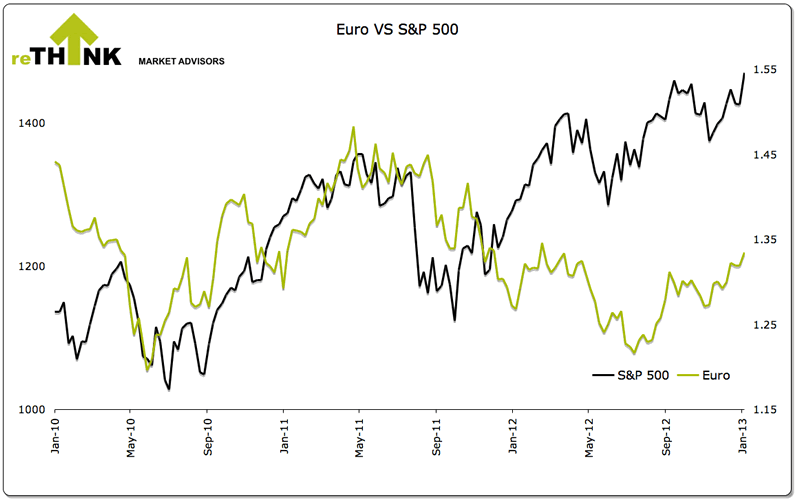
For the week ending January 11, 2013, the EUR was up 2.1%, copper was down 1.1%, 30 year yield was down 6bp and the Aussie Dollar was up 0.5%.
As of Friday's close copper was failing model support and would trigger short in the coming sessions with a close below 3.58. What's interesting about this failure of support on Friday is that copper was down 140 bp on the session amid a weak USD.
The multi-month divergence with equity and the EUR, AUD, copper and 30 year yield remains. As a result equity may show greater relative weakness as part of any future asset class convergence. Therefore, using any of these asset classes as a directional indicator may likely produce false signals.
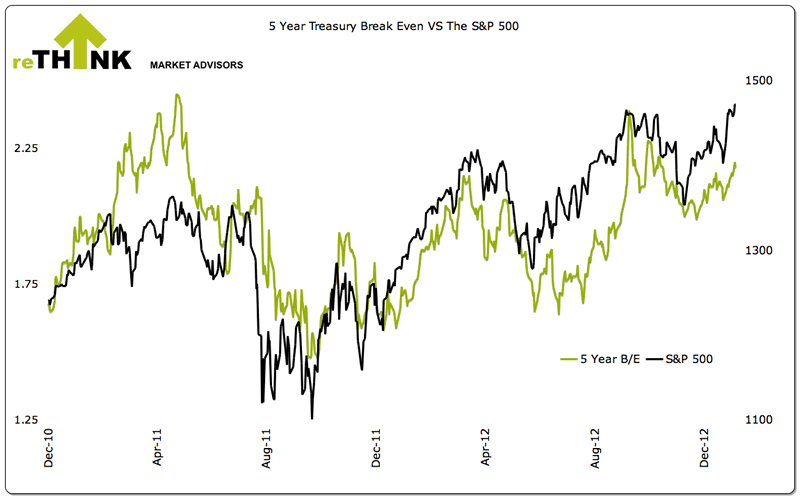
There is also a noticeable divergence with the 5 year Treasury break even as shown below.
Sentiment
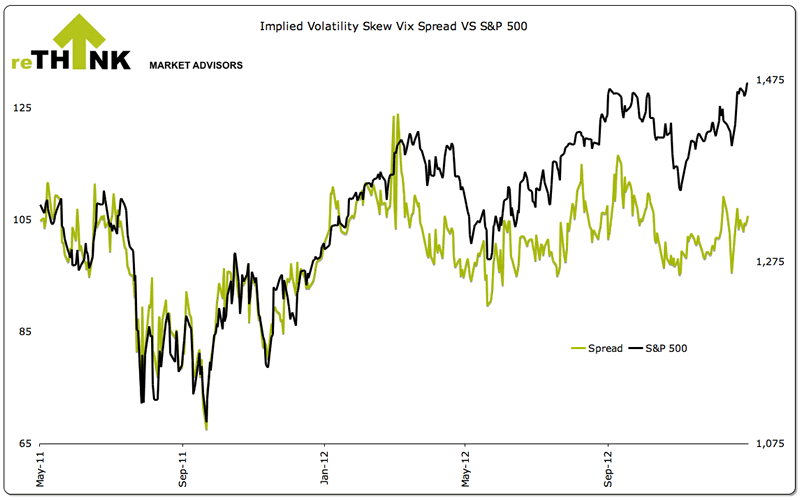
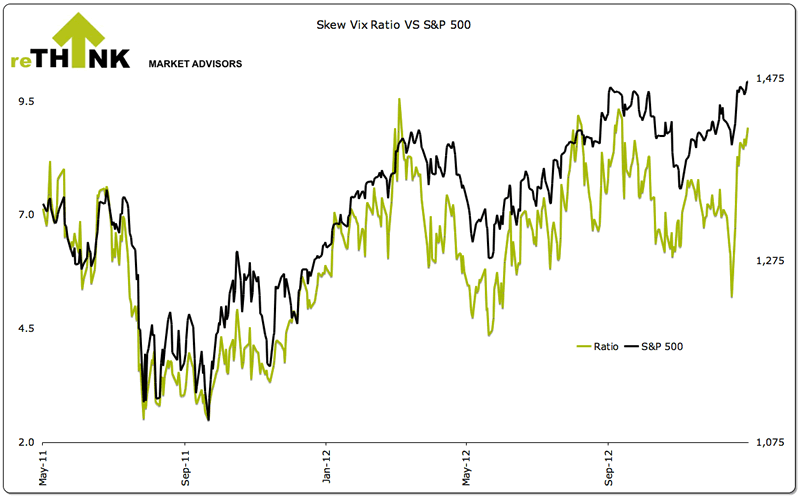
Market sentiment remains extremely complacent as viewed through the options market with the VIX at a 6 year low and implied volatility skew averaging 117 on the week.
Skew is a measure of how implied volatility is distributed. The lower the reading the less skewed the curve, indicating a normalized distribution.
Funds Flow
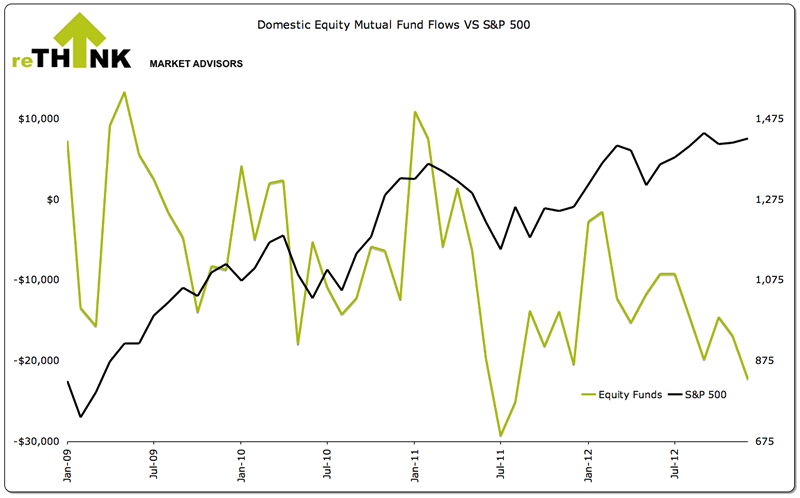
For the week ending January 3, 2013, $8.3 billion flowed out of domestic equity funds while $3.2 billion flowed in to both municipal and taxable bonds. A very sharp divergence exists over the past few months as domestic equity has seen a net drawdown while equity markets have moved higher.
For the month of December, domestic equity funds had a net outflow of $22.0 billion while bond funds had a net inflow of $9.8 billion. For 2012, domestic equity funds had a net outflow of $149.3 billion while bonds funds had a net inflow of $295.4 billion.
Bottom Line
We remain waiting for a test of support in determining future market direction. You never chase a market nor do you chase this move. At a minimum support will be tested. If that holds a new uptrend will form. If that fails, we will likely see resumption of the downtrend. There is no sense getting emotional or speculating where the market will go. Let the market show it's hand. It always does.
About The Big Picture: All technical levels and trends are based upon Rethink Market Advisor models, which are price and momentum based. They do not use trend lines nor other traditional momentum studies. To learn more about how the models work, please click here or visit http://rethink-markets.com/model-profile
© 2012 Copyright Tony Pallotta - Disclaimer: The above is a matter of opinion provided for general information purposes only and is not intended as investment advice. Information and analysis above are derived from sources and utilising methods believed to be reliable, but we cannot accept responsibility for any losses you may incur as a result of this analysis. Individuals should consult with their personal financial advisors.
Tony Pallotta Archive |
© 2005-2022 http://www.MarketOracle.co.uk - The Market Oracle is a FREE Daily Financial Markets Analysis & Forecasting online publication.