UK Trade Goods Data 2007- Exports Fell by 10%, Imports Rose by 2%
Economics / UK Economy Mar 14, 2008 - 12:43 AM GMTBy: HMRC
 UK Regional Trade in Goods estimates are released today, for the fourth quarter of 2007 .
• Total value of UK exports for the 12 months ending December 2007 was £218,919m.
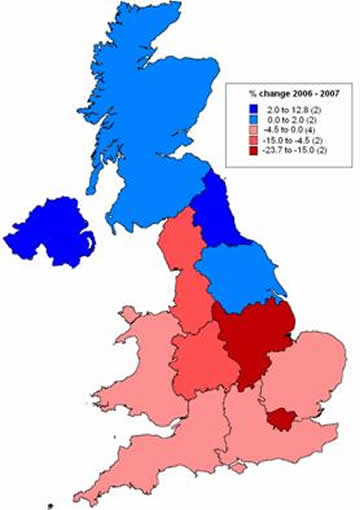
• The total value of UK exports for the 12 months ending December 2007 fell by £24,902m (10 per cent) compared to the 12 months ending December 2006.
• The value of UK exports to the EU decreased by £25,595m (17 per cent) in the same period. Northern Ireland was the only country of the UK that had an increase.
• The value of UK exports to countries outside the EU increased by £693m (1 per cent).
There were increases in five regions and countries of the UK with the largest increase in North East (£1,133m).
Imports
• The total value of UK imports for the 12 months ending December 2007 was £308,689m.
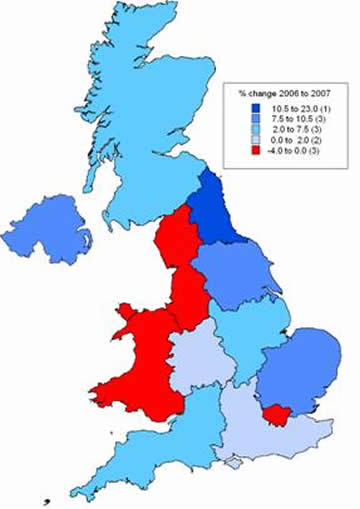
• The total value of UK Imports for the 12 months ending December 2007 rose by £6,725m (2 per cent) compared to the previous 12 months.
• The value of UK Imports from the EU increased by £4,039m (2.5 per cent) in the same period. Decreases were only seen in the North West , London and Wales .
• The value of UK Imports from countries outside the EU increased by £2,686m (2 per cent). Nine of the 12 regions and countries of the UK saw increases, with the largest increase in Yorkshire and The Humber (£1,326m). The largest percentage increase was in the North East (44 per cent).
Comparison of Exports and Imports between 2006 and 2007 are affected by changes in trade associated with VAT carousel fraud (MTIC) and by EU enlargement in January 2007.
| Figure 1: UK Trade-in-goods exports by region 1 | Figure 2: UK Trade-in-goods imports by region 1 |
 |
 |
Comparison of Exports and Imports to other EU Member States between 2006 and 2007 are affected by changes in trade associated with VAT carousel fraud (MTIC) and by EU enlargement in January 2007.
1 Figures refer to the percentage change between the rolling years 2006 Q1 to 2006 Q4 and 2007 Q1 to 2007 Q4
Source: Regional Trade Statistics, HM Revenue & Customs
• HM Revenue & Customs (HMRC) has today published a set of new regional trade statistics figures for the fourth quarter 2007. The 2007 data is provisional, and subject to the normal updates in overseas trade statistics relating to late receipt and amendments of trade declarations.
• The News Release uses the new EU27 country group as from Quarter one, 2007, including Bulgaria and Romania . A corresponding change follows for the non-EU country group.
• Data taken primarily from Customs systems (for non-EU trade) and the Intrastat survey. HMRC do not receive information in respect of goods that move wholly within the UK , nor in intangibles and services such as banking or tourism. Trade is mainly allocated to a region by the postcode associated with a company's VAT registration, and aggregated tables are produced to facilitate time series analysis. These tables are provided in a separate document released in conjunction with this News Release.
• Some adjustments have been necessary in the production of export statistics by region to ensure manufacturing that takes place at branch premises is properly allocated to the region where the branch is situated. However, adjustments are not made to import statistics and therefore, in some cases, trade has been allocated to the region where the head office is situated.
• Regional Trade Statistics (RTS) total values differ slightly from the UK level Overseas Trade Statistics; RTS does not include estimates for non-response, including estimates for the missing EU Imports associated with Missing Trader Intra-Community VAT Fraud (MTIC Fraud).
See http://www.uktradeinfo.com/pagecontent/documents/MTIC_Oecd.pdf for more information.
• Data for 2005 onwards are based on the revised methodology used to calculate trade statistics concerning Gas and Electricity. As they are now calculated on a physical flow rather than fiscal transaction, there is no satisfactory method to allocate this trade to a region. It has therefore been allocated to the Unknown region.
• The Regional Trade Statistics also include estimates made for trade below the Intrastat threshold.
• Estimates relating to trade in goods within classification codes that have changed since the previous year are not assigned to a region but are included within ‘Unknown region' for completeness.
• Information on the methodology used for the Regional Trade Statistics time series can be obtained from the National Statistics website on www.statistics.gov.uk and also on the trade statistics information website www.uktradeinfo.com .
• The Regional Trade in Goods figures are in the scope of National Statistics. National Statistics are produced to high professional standards set out in the National Statistics Code of Practice. They undergo regular quality assurance reviews to ensure they meet customer needs. They are produced free from any political interference.
• The next release will be published on 12 June 2008 . This will include revised data for the first four quarters of 2007 and a set of new regional trade statistics figures for first quarter 2008.
For further information please contact:
uktradeinfo Customer Services,
Knowledge, Analysis and Intelligence: Trade Statistics
HM Revenue & Customs,
5th Floor South Central,
Alexander House,
21 Victoria Avenue,
Southend-on-Sea,
SS99 1AA
Telephone: 01702 367485
E-mail: uktradeinfo@hmrc.gsi.gov.uk,
Fax: 01702 366596
(c) Crown copyright 2006.
Information about HM Revenue & Customs can be found on our website: http://www.hmrc.gov.uk For this news release and other information visit http://www.uktradeinfo.com for authoritative and up to date information on UK Trade.
If using specific facts contained in this release please check the information is still current.
Issued by HM Revenue & Customs Press Office Website: http://www.hmrc.gov.uk
© 2005-2022 http://www.MarketOracle.co.uk - The Market Oracle is a FREE Daily Financial Markets Analysis & Forecasting online publication.


