


Why Energy is Catching the Stock Market's Eye
Commodities / Energy Resources Apr 22, 2014 - 10:26 AM GMTBy: Frank_Holmes

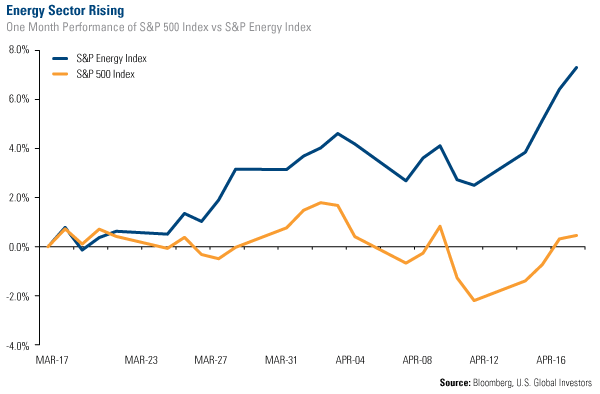
 Over the last month the energy sector has outperformed the market, and as you can see in the chart below, has done so by 6.5 percent. Year-to-date the sector is beating the S&P 500 Index by over 3 percent.
In a spectacularly performing market during 2013, energy lacked some of the incredible performance seen throughout the other sectors, but recently it has turned up, catching the attention of the market yet again.
What's causing this sudden shift in relative strength?
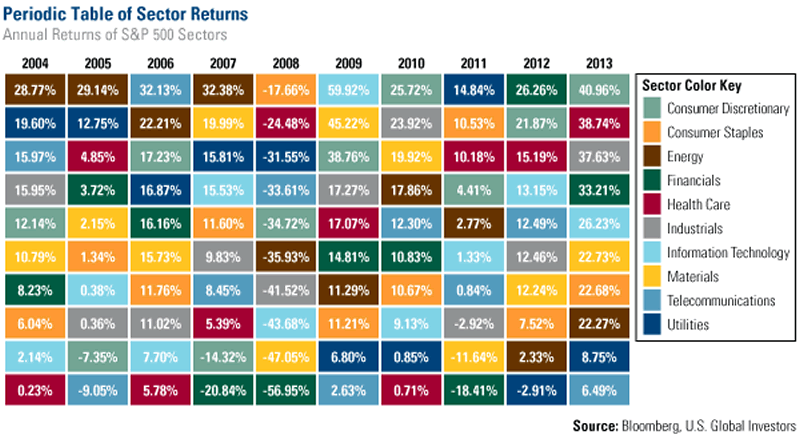
As our Director of Research John Derrick describes in our recent video on the Periodic Table of Sector Returns, it is not unusual to see sectors move from top to bottom from one year to the next. For example, energy ranked as one of the top-performing sectors from 2004 through 2007, but quickly lost momentum in 2008 when it was hit the hardest after the financial crisis. In 2012 and 2013 energy turned in some solid numbers, but lagged in comparison to the other sectors.
In looking at an overview of market performance, it's important to recognize what caused the moves. For example, one reason the energy sector is climbing back up, could be due to the broader market rotation that we've noticed recently, from growth stocks to value stocks.
Growth stocks are generally successful companies that are expected to continue growing their earnings, usually at a rate that outpaces the market, causing investors to pay more for them. Value stocks rarely outpace the market as much as growth stocks do. Investors see potential in buying these cheaper names, ones that trade at lower price-to-earnings (P/E) ratios than the S&P average, because they still have the potential to significantly outperform over time.
As I mentioned, in the past few weeks high-growth names have pulled back, while value names are steadily gaining momentum. One of the main reasons for this rotation is that some investors view the valuations of growth names as too high, especially in comparison to the value companies.
What's significant is that many of these value names happen to be in the energy sector. We've taken advantage of this shift to value in our Global Resorces Fund (PSPFX) through names like Pacific Rubiales and Valero Energy.
Although this rotation is important to the recent moves in energy, it is not the only factor driving the sector up. Take a look at the price of oil and natural gas.
Currently natural gas prices are starting to stabilize while the price of West Texas Intermediate (WTI) crude oil is up by 4 percent year-to-date, reaching $104 a barrel just last week. This price increase in WTI is linked to concerns over future supply, but nevertheless higher oil prices bode well for stocks within the energy sector.
According to the Energy Information Administration (EIA), short-term projections for the price of WTI remain relatively high. Additionally, the group commented that, "Aside from seasonal issues, the EIA expects strong crude oil production growth, primarily concentrated in the Bakken, Eagle Ford, and Permian regions, continuing through 2015. Forecast production increases from an estimated 7.4 million barrels per day in 2013 to 8.4 million barrels per day in 2014 and 9.1 million barrels per day in 2015." This projection is good for North American producers and service companies.
So how can you gain entry into this energy opportunity?
The portfolio managers and I continue to stay focused on companies that show robust fundamentals and are located in sectors showing strength. Currently, within our Global Resources Fund (PSPFX), we are capturing the latest takeoff in the energy sector through our exposure to companies that are reasonably valued. In addition to the two I mentioned previously, if you look at the fund's top 10 holdings you will also see our investments in large-cap names like Schlumberger Ltd, EOG Resources and Halliburton Co.
Are you ready to energize your portfolio? I believe a well-diversified portfolio includes exposure to natural resources. In fact, I was just in Tirana, the capital city of Albania, where I have had the opportunity to expand my tacit knowledge by visiting several resource companies.
I am excited to share my journey with you this week when I return home!
Want to receive more commentaries like this one? Sign up to receive email updates from Frank Holmes and the rest of the U.S. Global Investors team, follow us on Twitter or like us on Facebook.
By Frank Holmes
CEO and Chief Investment Officer
U.S. Global Investors
U.S. Global Investors, Inc. is an investment management firm specializing in gold, natural resources, emerging markets and global infrastructure opportunities around the world. The company, headquartered in San Antonio, Texas, manages 13 no-load mutual funds in the U.S. Global Investors fund family, as well as funds for international clients.
All opinions expressed and data provided are subject to change without notice. Some of these opinions may not be appropriate to every investor.Standard deviation is a measure of the dispersion of a set of data from its mean. The more spread apart the data, the higher the deviation. Standard deviation is also known as historical volatility. All opinions expressed and data provided are subject to change without notice. Some of these opinions may not be appropriate to every investor. The S&P 500 Stock Index is a widely recognized capitalization-weighted index of 500 common stock prices in U.S. companies. The NYSE Arca Gold BUGS (Basket of Unhedged Gold Stocks) Index (HUI) is a modified equal dollar weighted index of companies involved in gold mining. The HUI Index was designed to provide significant exposure to near term movements in gold prices by including companies that do not hedge their gold production beyond 1.5 years. The MSCI Emerging Markets Index is a free float-adjusted market capitalization index that is designed to measure equity market performance in the global emerging markets. The U.S. Trade Weighted Dollar Index provides a general indication of the international value of the U.S. dollar.
Frank Holmes Archive |
© 2005-2022 http://www.MarketOracle.co.uk - The Market Oracle is a FREE Daily Financial Markets Analysis & Forecasting online publication.