


Bond Market Prices in a Rising Rate Environment
Interest-Rates / US Bonds Jul 08, 2014 - 06:45 AM GMTBy: Richard_Shaw

 JP Morgan Asset Management put out their Q3 2014 market outlook in which they discuss bond performance in a rising rate market. You should be aware of the key points they make.
In this table, JPM explains how a 1% interest rate change would impact each of several types of bonds:
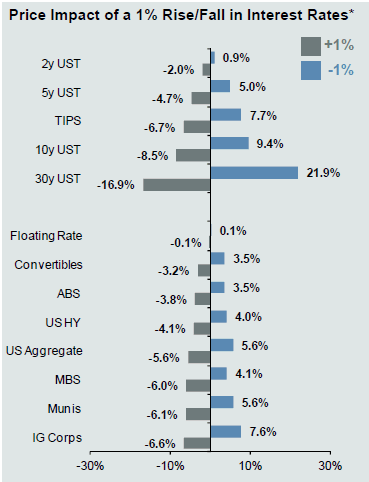
You can see that longer maturities have the greatest price reaction to rate changes; that floating rate loans have the lowest reaction to rate changes; and that the bond market in the aggregate has a roughly 5.6% price sensitivity to a 1% interest rate change. The average duration of that universe of bonds is about 5.6 years.
High yield bonds are bit less sensitive to rate changes than the aggregate bond index, and muni bonds are a bit more sensitive.
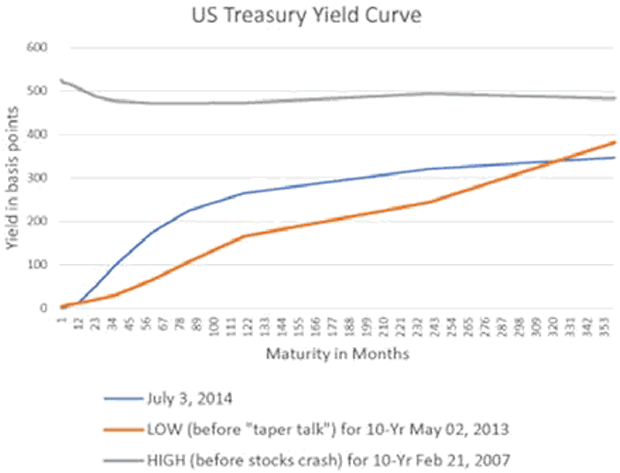
In the broadest sense, intermediate-term bonds might have a 1% upward rate change risk over the next year or two, while very short-term bonds might have a 1% to 2% upward rate change risk. Nobody really knows for sure.
This chart of the Treasury yield curve at different times may help with a feel for the potential rate changes.
Bottom line for us is that bonds have much more price risk than in the past few decades, because the long-term path of rates is likely up, as opposed to the long decline in rates from the early 1980s to the current era.
This chart shows you the downward yield path over 30+ years for 3-mo, 2-yr, 10-yr and 30-yr Treasuries.
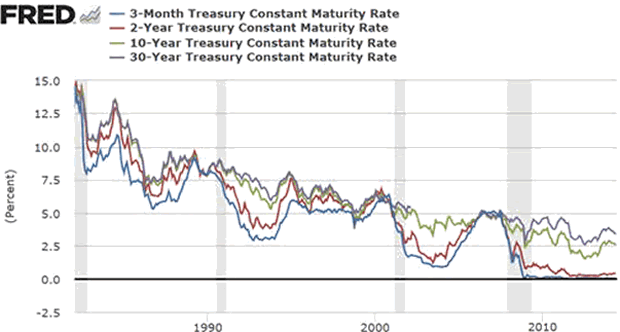
Those days are behind us, and a rise in rates and declines in issued bond prices are eventually in store.
By Richard Shaw
http://www.qvmgroup.com
Richard Shaw leads the QVM team as President of QVM Group. Richard has extensive investment industry experience including serving on the board of directors of two large investment management companies, including Aberdeen Asset Management (listed London Stock Exchange) and as a charter investor and director of Lending Tree ( download short professional profile ). He provides portfolio design and management services to individual and corporate clients. He also edits the QVM investment blog. His writings are generally republished by SeekingAlpha and Reuters and are linked to sites such as Kiplinger and Yahoo Finance and other sites. He is a 1970 graduate of Dartmouth College.
Copyright 2006-2013 by QVM Group LLC All rights reserved.
Disclaimer: The above is a matter of opinion and is not intended as investment advice. Information and analysis above are derived from sources and utilizing methods believed reliable, but we cannot accept responsibility for any trading losses you may incur as a result of this analysis. Do your own due diligence.
Richard Shaw Archive |
© 2005-2022 http://www.MarketOracle.co.uk - The Market Oracle is a FREE Daily Financial Markets Analysis & Forecasting online publication.