U.S. Treasury Bull Market 33rd Anniversary of The Greatest Risk Adjusted Returns in Anglo-American History
Interest-Rates / US Bonds Sep 08, 2014 - 12:04 PM GMTBy: Jas_Jain
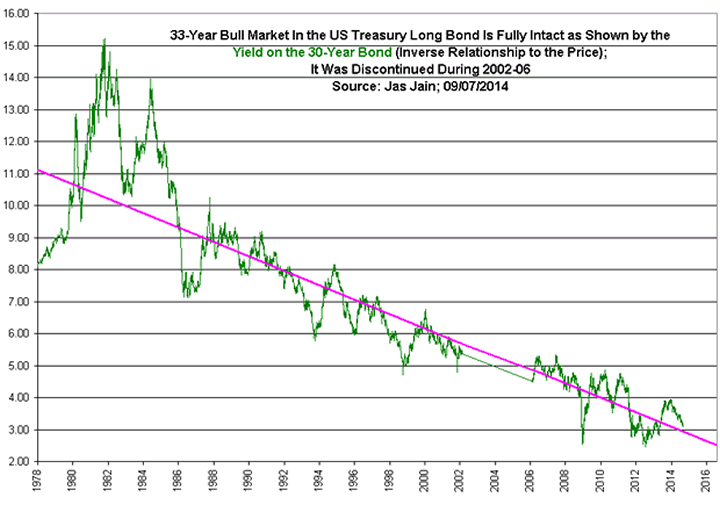
 As we approach the 33rd anniversary of the bull market in the US Treasury 30-year bond, the up-trend in the price, or downtrend in the yield, is fully intact as can be seen in Figure 1.

Those who have read my commentaries for the past 16 years can attest to the fact that I am the biggest bull around on the long-term US Treasury bonds and I have put my money and my family's money where my mouth is. My retirement account is many times what it was when I retired in March 2000 despite the fact that I have been taking withdrawals every year for the past six years. It is a well-kept secret that the long-term US Treasury bond for the past 33 years has been the best investment, adjusted for risk, in the Anglo-American history, at least since the days of Isaac Newton as the Chancellor of the Exchequer. When this bull market in the long bond reaches its zenith in the next 2-4 years during the coming depression, after which the gains would be meager, it would have out-performed the stock market handily.
The US economy has had the worst growth over a 14-year period, to the extent that we have the data or other information, and by the end of this decade it would have the worst 20-year growth, far worse than during 1930-49, the period of the Great Depression. That is the primary reason that the yields on the 30-year Treasury bond have been going down and headed much lower, below 2%, with the 10-Year Note yield is headed below 1%.
Liar Liar Pants on Fire
Deceiver, dissembler Your trousers are alight From what pole or gallows Shall they dangle in the night? ... What red devil of mendacity Grips your soul with such tenacity? Will one you cruelly shower with lies Put a pistol ball between your eyes? ... ~ William Blake
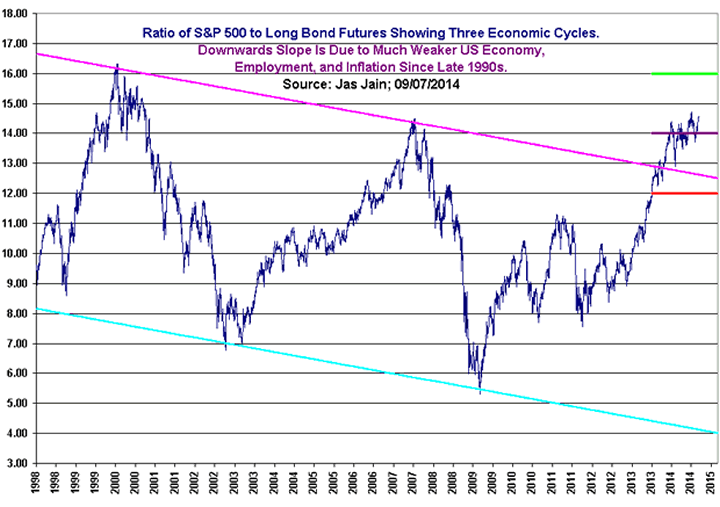
We are not talking about a schoolyard fight between children but the titans of the financial markets, a fight between the US stock market and the 30-year US Treasury bond market. One of them is lying. Since the beginning of the year there has been a tug of war between these two markets; the stock market sees a growing economy at 3% annual rate and the bond market sees a weakening economy and even a chance of a recession. This tug of war can be seen in Figure 2 that shows the ratio of S&P 500 to the 30-Year bond future and the rope is shown in purple. Both sides are pulling the rope in their direction and going back and forth of the center-line. The ratio has all the characteristics of a cycle peak for the economy as well as the stock market.

The Next US Recession
Recently, David Rosenberg, a former bear turned bull, said, "...history suggests that the next recession is at LEAST four years away." This is such an absurd prediction that it merits no further comment. As a trained economist he has the license to lie about the next recession, as do all the Chairpersons of the Federal Reserve since Greenspan. That is how they defend the stock market bubbles because if there is going to be no recession over the next 2-3 years, as per their forecasts, then the high stock market could be justified, bubble or no bubble. The ability to lie to serve Wall Street and appear credible is the key to their getting appointed.
My prediction based on the ratio in Fig. 2 is that the next recession is likely to begin before the end of 2015Q1. What would negate this prediction? If the ratio goes above the green line before the end of 2014. On the other hand, if the ratio goes below the red line, at any time, then the recession should follow in few short months. Between the stock market and the long-term bond market the history suggests that the stock market lies.
By Jas Jain , Ph.D.
the Prophet of Doom and Gloom
Copyright © 2014 Jas Jain - All Rights Reserved Disclaimer: The above is a matter of opinion provided for general information purposes only and is not intended as investment advice. Information and analysis above are derived from sources and utilising methods believed to be reliable, but we cannot accept responsibility for any losses you may incur as a result of this analysis. Individuals should consult with their personal financial advisors.
© 2005-2022 http://www.MarketOracle.co.uk - The Market Oracle is a FREE Daily Financial Markets Analysis & Forecasting online publication.


