


Stock Market Seven Year Cycle and A Correction Ahead?
Stock-Markets / Stocks Bear Market Oct 17, 2014 - 09:05 AM GMT

 From a duration perspective, is the current uptrend in today’s stock market getting risky? Based on history, should one assume that a correction may be nearing? Our main consideration of the following charts of the S&P 500 is the duration of the turning points.
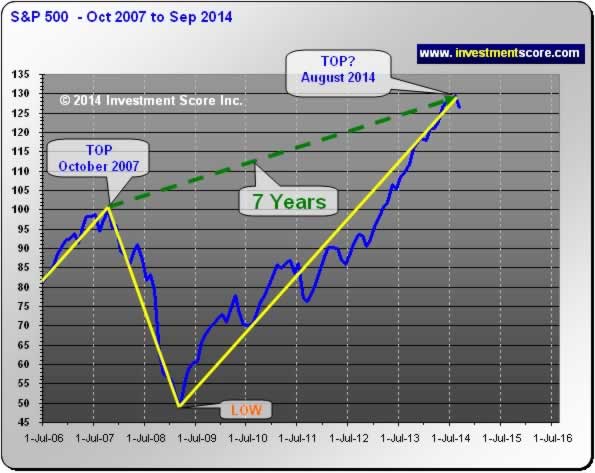
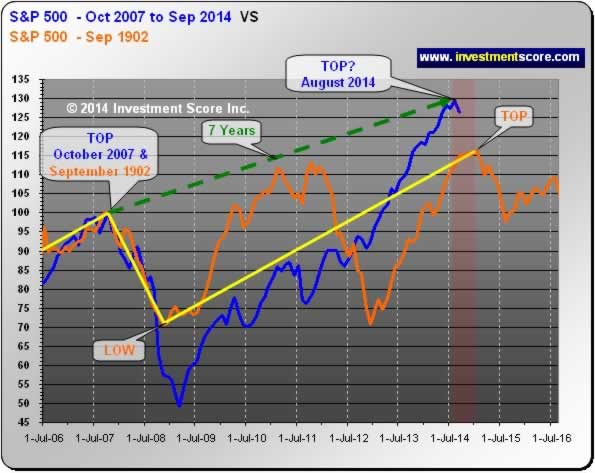
In the next set of charts we took a historical “Top” and the October 2007 “Top” and indexed them to 100 so that we could compare the price action.
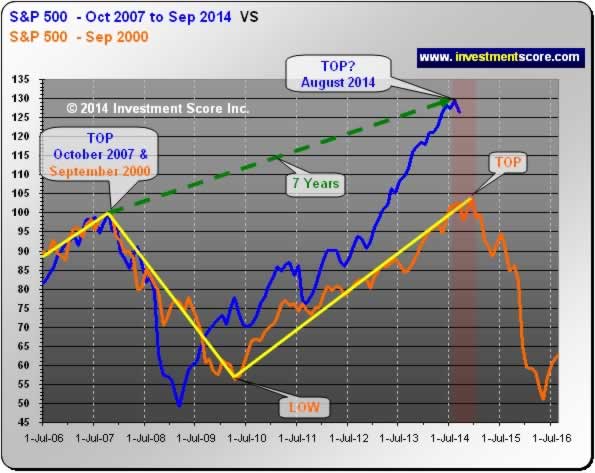
In the above chart, notice the orange line formed a top about seven years from the September 2000 Top. It would appear that this seven year ‘top to top’ cycle is not that uncommon.
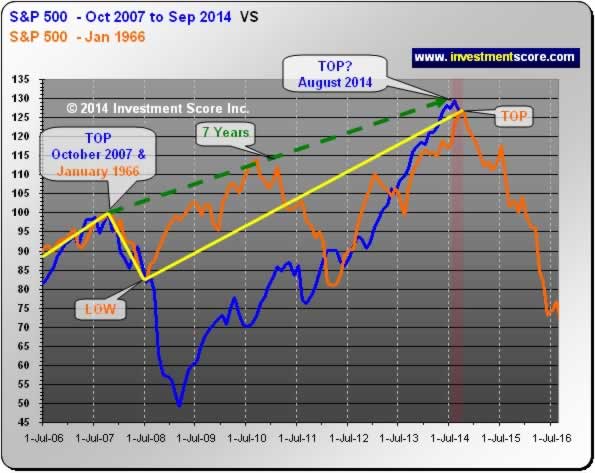
Although the pattern after the 2007 correction and 1966 correction are not identical, the consistent seven year timeframe from peak to peak is important to note in the above chart.
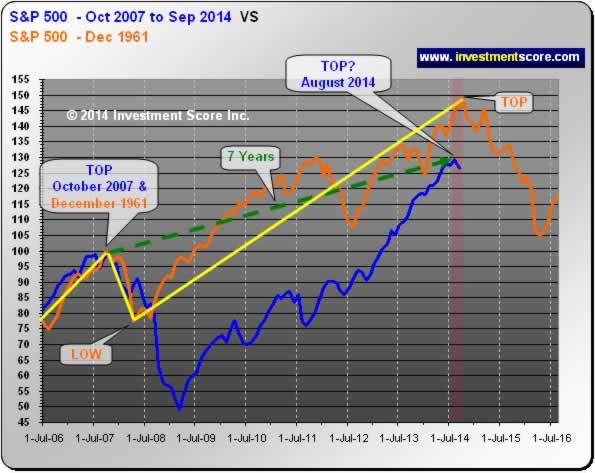
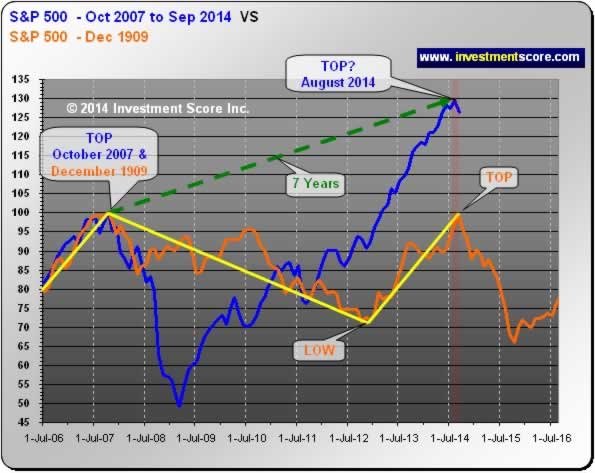
In the above chart the orange line (1909) does not climb nearly as high as the blue line (2007) after advancing to August 2014; however in 1909 (orange line) the United States was tied to a “Gold Standard”, likely resulting in less inflationary effects.
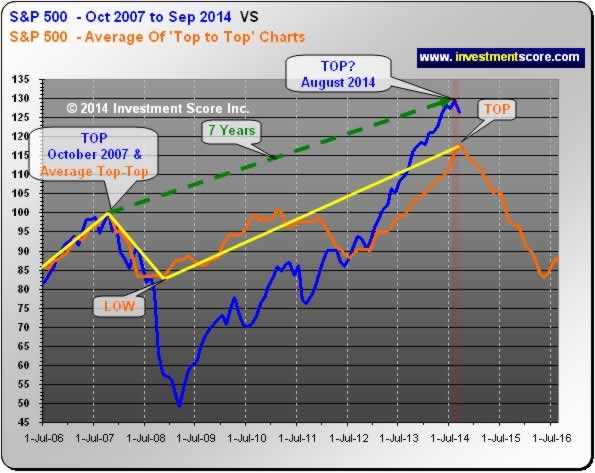
The above chart is an average of the other indexes that illustrates a seven year top to top market formation. Of course it would be easy to find any data point that starts seven years prior to a historical top; the observation that we find fascinating is how actual market tops can regularly occur in seven year intervals.
The following charts are even more fascinating as they outline fourteen years of market action.
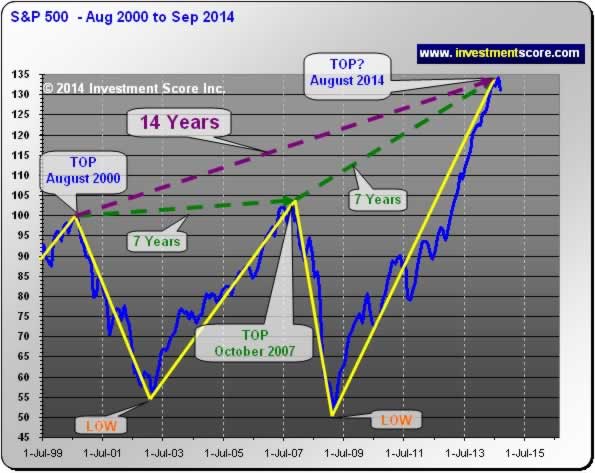
Notice how the August 2000 top has resulted in a seven year correction and advance followed by another potential seven year correction and advance. Fourteen years for any market pattern to repeat even remotely closely seems to be worth noting, and yet we have found a handful of other examples. (1902, 1906 and 1959).
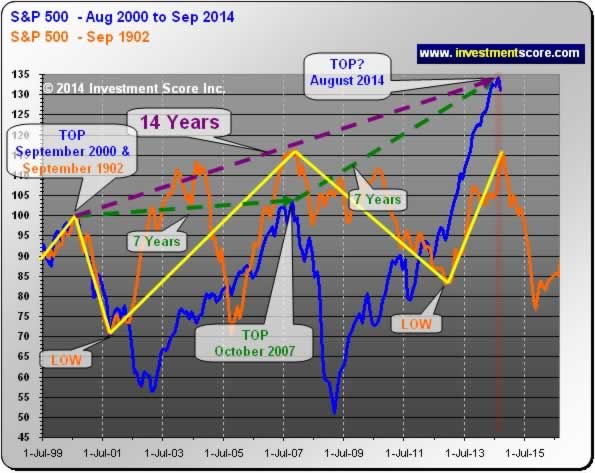
Perhaps if the Gold Standard were still in effect in the United States, the current market action would mimic the 1902 market more closely. Either way, this example of seven year tops is fascinating, and the above charts may be a reasonable indication that a top may be nearing. However, we would like to note that there are always exceptions and nothing “has” to change one way or the other. It may also be possible that the stock market is at the start of spectacular new bull market that will last for many years to come. According to our research and market fundamentals, it is our opinion that a correction may be more likely.
By Michael Kilback
Investmentscore.com
Investmentscore.com is the home of the Investment Scoring & Timing Newsletter. Through our custom built, Scoring and Timing Charts , we offer a one of a kind perspective on the markets.
Our newsletter service was founded on revolutionary insight yet simple principles. Our contrarian views help us remain focused on locating undervalued assets based on major macro market moves. Instead of comparing a single market to a continuously moving currency, we directly compare multiple major markets to one another. We expect this direct market to market comparison will help us locate the beginning and end of major bull markets and thereby capitalize on the largest, most profitable trades. We pride ourselves on cutting through the "noise" of popular opinion, media hype, investing myths, standard over used analysis tools and other distractions and try to offer a unique, clear perspective for investing.
Disclaimer: No content provided as part of the Investment Score Inc. information constitutes a recommendation that any particular security, portfolio of securities, transaction or investment strategy is suitable for any specific person. None of the information providers, including the staff of Investment Score Inc. or their affiliates will advise you personally concerning the nature, potential, value or suitability or any particular security, portfolio of securities, transaction, investment strategy or other matter. Investment Score Inc. its officers, directors, employees, affiliates, suppliers, advertisers and agents may or may not own precious metals investments at any given time. To the extent any of the content published as part of the Investment Score Inc. information may be deemed to be investment advice, such information is impersonal and not tailored to the investment needs of any specific person. Investment Score Inc. does not claim any of the information provided is complete, absolute and/or exact. Investment Score Inc. its officers, directors, employees, affiliates, suppliers, advertisers and agents are not qualified investment advisers. It is recommended investors conduct their own due diligence on any investment including seeking professional advice from a certified investment adviser before entering into any transaction. The performance data is supplied by sources believed to be reliable, that the calculations herein are made using such data, and that such calculations are not guaranteed by these sources, the information providers, or any other person or entity, and may not be complete. From time to time, reference may be made in our information materials to prior articles and opinions we have provided. These references may be selective, may reference only a portion of an article or recommendation, and are likely not to be current. As markets change continuously, previously provided information and data may not be current and should not be relied upon.
Investmentscore.com Archive |
© 2005-2022 http://www.MarketOracle.co.uk - The Market Oracle is a FREE Daily Financial Markets Analysis & Forecasting online publication.