


Stocks Bear Market Rally Underway
Stock-Markets / Stocks Bear Market Jan 30, 2016 - 04:39 PM GMTBy: Tony_Caldaro

 Another volatile week! The week started off at SPX 1907, traded down to 1876 on Monday, then rallied to 1917 on Wednesday before the FOMC statement. After the statement was released the market traded down to SPX 1873, retested that low on Thursday, then rocketed higher on Friday to end the week at SPX 1940. For the week the SPX/DOW gained 2.05%, the NDX/NAZ gained 0.50%, and the DJ World index gained 2.10%. Economic reports for the week were positive. On the uptick: Case-Shiller, the FHFA, consumer confidence, new/pending home sales, the Chicago PMI, plus weekly jobless claims improved. On the downtick: durable goods, Q4 GDP, consumer sentiment and the WLEI. Next week we get reports on the PCE, the ISM’s and monthly Payrolls.
LONG TERM: bear market
After an unorthodox ending to a six year bull market, a bear market began in December 2015. Thus far it appears the market has completed its first wave down, Major wave a, of the bear market when it declined from the uptrend high at SPX 2116 to SPX 1812 in January. Since that low the market rallied to SPX 1909, struggled to make much progress for several days, and then rallied to SPX 1940 on Friday. This choppy nearly 130 point rally appears to be Major wave b, or the first uptrend of the bear market.
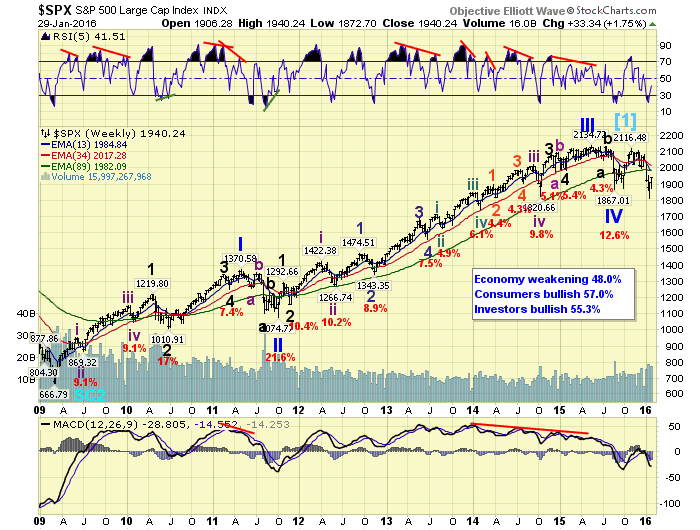
Typically uptrends during bear markets retrace anywhere from 38.2% to 61.8% of the previous, or larger, decline. The three retracement levels, as noted last week, suggested the following potential uptrend highs: 1928 (38.2%), 1964 (50.0%) and 2000 (61.8%). Anything more than that would be quite unusual. We had noted, also last week, that the first two levels were near the OEW 1929 and 1956 pivots. On Friday the lower level was easily exceeded, so the next likely upside target is the 1956 pivot range.
After this uptrend concludes, which may be soon, we expect the next downtrend, Major wave c, to start off in a choppy pattern and then to make new lows in March. When this begins we can then start to make some downside projections for its low. Bear markets are usually quite volatile in both directions. Uptrends are often good times to unload selective stocks, and/or hedge existing positions. Downtrends are often quite breathtaking. Since this is the first uptrend of the bear market it is probably the last opportunity to take advantage of higher prices.
MEDIUM TERM: potential uptrend underway
After the unorthodox bull market high at SPX 2104 we labeled the Major wave a downtrend to SPX 1812 as a complex zigzag: Int. a SPX 1993, Int. b SPX 2082, and Int. c SPX 1812. At the low the daily MACD was quite oversold, and the RSI set up a positive divergence. This is usually a sign that a downtrend may be ending in favor of a counter-trend uptrend. The market then rallied nearly 100 points in two days, kicking off the uptrend. And on Friday added to those gains.
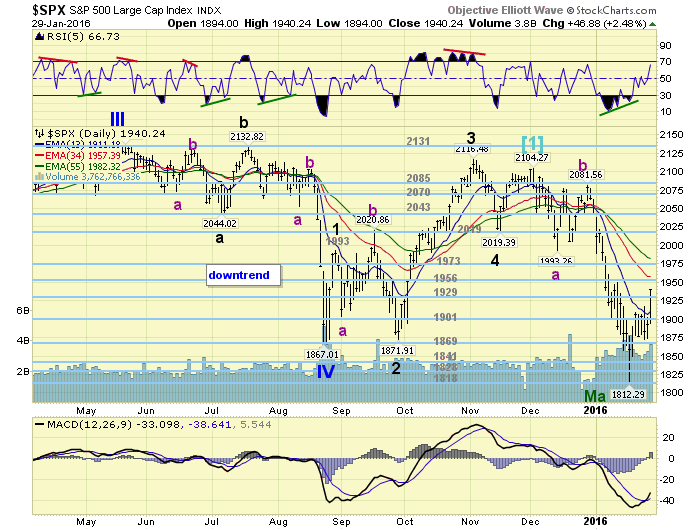
While the downtrend took about 1.5 months to unfold, which is about normal these days. Uptrends during bear markets are usually quite a bit shorter. This potential uptrend has rallied nearly 140 points in just 8 days and is already nearing its upside retracement targets. Three of the five uptrends during the last bear market only lasted 2 – 4 weeks. And, the two that lasted longer were either retracing a larger pattern or a very steep decline. Neither of which has occurred yet in this bear market.
One last note. Typically during bear market uptrends they only manage to get slightly RSI overbought on the daily chart. The RSI is currently quickly approaching that level. Medium term support is at the 1929 and 1901 pivots, with resistance at the 1956 and 1973 pivots.
SHORT TERM
After the Major wave A low we started labeling the Major B uptrend with three Intermediate waves: a-b-c. Intermediate wave a was a bit choppy, unfolded in an a-b-c, (1890-1860-1909), and topped at SPX 1909. Then we had a quite tricky Intermediate wave b, thanks to the reaction after the FOMC, that took the form of an irregular a-b-c pattern: 1876-1917-1873. Intermediate wave c kicked in off that low and has already unfolded in three waves: 1899-1886-1940. Although the last wave may not yet be complete.
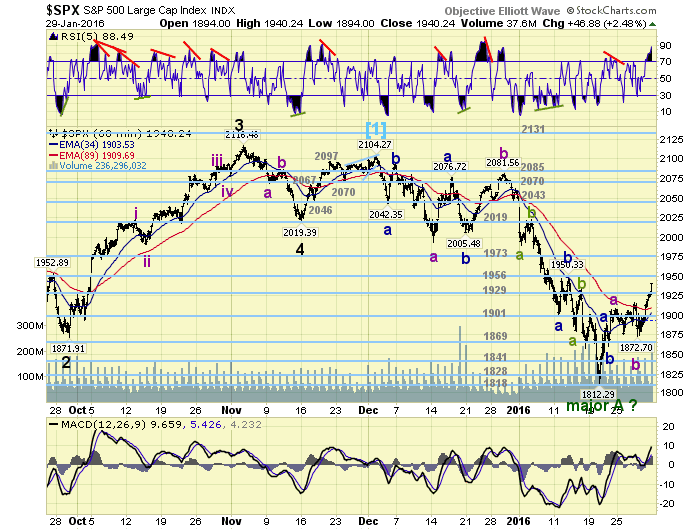
When we compare Intermediate waves C and A during this uptrend, the mostly likely Fibonacci target is SPX 1971. This is where Int. C = Int. A. The other Fibonacci relationships have already been exceeded. Overall we are now looking at three possible levels to end this uptrend: OEW 1956 and 1973 pivots, and SPX 2000. Short term support is at the 1929 and 1901 pivots, with resistance at the 1956 and 1973 pivots. Short term momentum ended the week extremely overbought. A short term negative divergence, and a medium term overbought condition could fit quite well for an uptrend high. Best to your trading!
FOREIGN MARKETS
Asian markets were nearly all higher on the week for a net gain of 1.3%.
Europe markets were also almost all higher for a gain of 1.2%.
The Commodity equity group were all higher and gained 5.5%.
The DJ World index appears to be uptrending and gained 2.1%.
COMMODITIES
Bonds continue to uptrend and gained 1.0% on the week.
Crude is trying to uptrend and gained 4.3% on the week.
Gold continues to uptrend and gained 1.7% on the week.
The USD confirmed its uptrend but only gained 0.1% on the week.
NEXT WEEK
Monday: the PCE and Personal income/spending at 8:30, Construction spending and ISM manufacturing at 10am, then a Monetary policy discussion at the CFR with FED vice chair Fischer at 1pm. Tuesday: Auto sales. Wednesday: the ADP, and ISM services. Thursday: weekly Jobless claims and Factory orders. Friday: monthly Payrolls, the Trade deficit and Consumer credit.
CHARTS: http://stockcharts.com/public/1269446/tenpp
After about 40 years of investing in the markets one learns that the markets are constantly changing, not only in price, but in what drives the markets. In the 1960s, the Nifty Fifty were the leaders of the stock market. In the 1970s, stock selection using Technical Analysis was important, as the market stayed with a trading range for the entire decade. In the 1980s, the market finally broke out of it doldrums, as the DOW broke through 1100 in 1982, and launched the greatest bull market on record.
Sharing is an important aspect of a life. Over 100 people have joined our group, from all walks of life, covering twenty three countries across the globe. It's been the most fun I have ever had in the market. Sharing uncommon knowledge, with investors. In hope of aiding them in finding their financial independence.
Copyright © 2016 Tony Caldaro - All Rights Reserved Disclaimer: The above is a matter of opinion provided for general information purposes only and is not intended as investment advice. Information and analysis above are derived from sources and utilising methods believed to be reliable, but we cannot accept responsibility for any losses you may incur as a result of this analysis. Individuals should consult with their personal financial advisors.
Tony Caldaro Archive |
© 2005-2022 http://www.MarketOracle.co.uk - The Market Oracle is a FREE Daily Financial Markets Analysis & Forecasting online publication.