


The Next Generational Bust Is Coming, Stock Market 70% Collapse
Stock-Markets / Stocks Bear Market Feb 02, 2016 - 03:00 PM GMTBy: Harry_Dent

 Oil can’t seem to get a break. After falling just below $27 last week, oil finally rallied back to $32 before falling back to just under $31 on Tuesday. An oversold bounce was naturally due, with perhaps a bit more to come. But the oil market’s doing exactly what I said it would – cratering!
Meanwhile, in la-la land, stocks have been so focused on the decline in oil prices that they just ignored the other big trigger for a stock decline.
And that came yesterday, when the Shanghai Composite index of Chinese stocks moved 3% below its August low of 2,850!
I wrote back in June of last year that the bubble in Chinese stocks looked ready to pop! Sure enough, it started the next day, fell about 32% in a month, rallied, then fell another 26% by late August. Together, that was a crash of 45%, from a high of 5,200 to a low of 2,850 in just two and a half months.
Then, after testing that level three times over the past two weeks – and avoiding it for several months – it finally broke beneath that level on Tuesday’s trading day in China.
I forecast back in early 2015 that oil would hit $30 to $32 by January of 2016 – and it went even lower than that. That was the other trigger for a global meltdown, as falling oil prices were bound to trigger the next junk bond collapse that is now already underway.
But at this point, I am now more worried about another major crash in Chinese stocks.
Think about it: have you seen another market, besides oil in late 2008, crash that much, that fast?
Sure, the word on Wall Street is that we don’t trade that much with China. And because we don’t “trade” with them, a greater slowdown there will not affect us that much.
What a load of bull!
Isn’t it that very slowdown that has caused commodity prices to collapse and kill so many emerging countries; and their often U.S. dollar-denominated bonds; and create falling oil prices that also threaten our fracking industry and many junk bonds here?
Here’s the big picture: since 2000, two stock bubbles have burst, and have brought stocks to lower than they were before. This one is no exception, and it’s already starting to burst.
I’ve been warning about this for a long time now, but stocks kept edging up until May of 2015 – after going nowhere since late 2014… and after – guess what – the Fed stopped spoon-feeding it with QE.
Once again, this bursting bubble will send stocks even lower than they were before.
I’ve used the “Dow Megaphone Pattern” before, but it bears repeating. Basically, this shows that as new bubbles take us to new highs and then burst, they ultimately crash and fall lower than they did in the last crash.
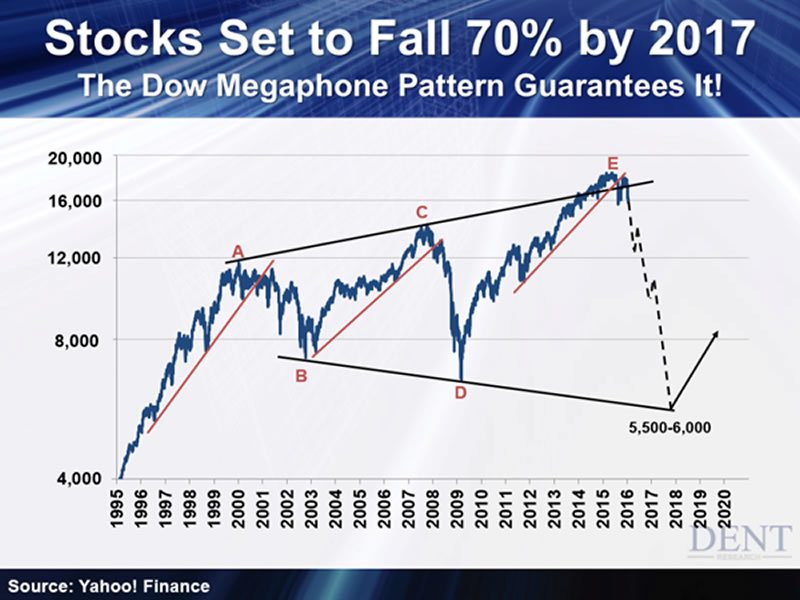
The first major sign came in August when stocks broke below their upward channel (the red line). Each previous bubble started to burst after similar uptrend lines were finally broken.
Then, stocks rallied in the last quarter of the year, but did not achieve a new high, and are now off to the worst start to a year in the stock market – ever.
Remember: bubbles don’t correct, THEY BURST. The next lower low on the Dow is set for 5,500 to 6,000 by early- to mid-2017.
Your broker will tell you to buy on dips and hold through this adjustment. They’ll say: “Stocks always come back.”
Tell that to someone who bought stocks in 1929 or 1968 at the top of the last two generational boom periods!
It took 24 to 25 years for stocks to get back to those levels.
The second major sign was that small-cap, or more typical stocks moved into a bear market after falling 26% recently. Consistent underperformance of small-caps is a classic sign of a major top and occurred in both 2000 and 2007.
Finally, the third major sign was the breach of the larger head-and-shoulders pattern in the S&P 500 with a break below 1,880 recently.
I had told our Boom & Bust subscribers that would be a key line in the sand, and the market quickly broke down to 1,812.
In the short-term, it was so oversold that it has started to bounce. But there’s no avoiding the lower low that is inevitable.
I don’t know if this rally lasts a few more days or a few more weeks. Our Chief Investment Strategist, Adam O'Dell, has more on that.
Harry
Follow me on Twitter @HarryDentjr
Harry studied economics in college in the ’70s, but found it vague and inconclusive. He became so disillusioned by the state of the profession that he turned his back on it. Instead, he threw himself into the burgeoning New Science of Finance, which married economic research and market research and encompassed identifying and studying demographic trends, business cycles, consumers’ purchasing power and many, many other trends that empowered him to forecast economic and market changes.
Copyright © 2016 Harry Dent- All Rights Reserved Disclaimer: The above is a matter of opinion provided for general information purposes only and is not intended as investment advice. Information and analysis above are derived from sources and utilising methods believed to be reliable, but we cannot accept responsibility for any losses you may incur as a result of this analysis. Individuals should consult with their personal financial advisors.
© 2005-2022 http://www.MarketOracle.co.uk - The Market Oracle is a FREE Daily Financial Markets Analysis & Forecasting online publication.