


Stocks Bear Market Rally Nearly Over
Stock-Markets / Stock Markets 2016 Mar 05, 2016 - 03:53 PM GMTBy: Tony_Caldaro

 The week started at SPX 1948. On Monday the market rallied to SPX 1958, then sold off to 1932 by the close. Tuesday, however, kicked off a rally with a gap up opening that carried the market to SPX 2009 by Friday afternoon. Then after a pullback to SPX 1993 the market closed 2000. For the week the SPX/DOW gained 2.45%, the NDX/NAZ gained 2.50%, and the DJ World index gained 4.0%. On the economic front reports again came in negatively biased again. On the uptick: construction spending, ISM manufacturing, the ADP, factory orders, monthly payrolls and the GDPn. On the downtick: the Chicago PMI, pending home sales, auto sales, ISM services, the WLEI, plus the trade deficit and weekly jobless claims increased. Next week two FED speeches on tap Monday, then the ECB meets on Thursday.
LONG TERM: bear market
After the bull market ended in December, on a failed fifth wave, the SPX entered a two month Major wave A downtrend which bottomed in mid-February at 1810. From that low a Major wave B uptrend was underway, which has now retraced 65% of the bear market’s first downtrend. This is quite normal activity during bear markets. The first uptrend of the 2007-2009 bear market retraced 69.4% of the first downtrend. After that the retracements were smaller and smaller, as the downtrends became larger and larger.
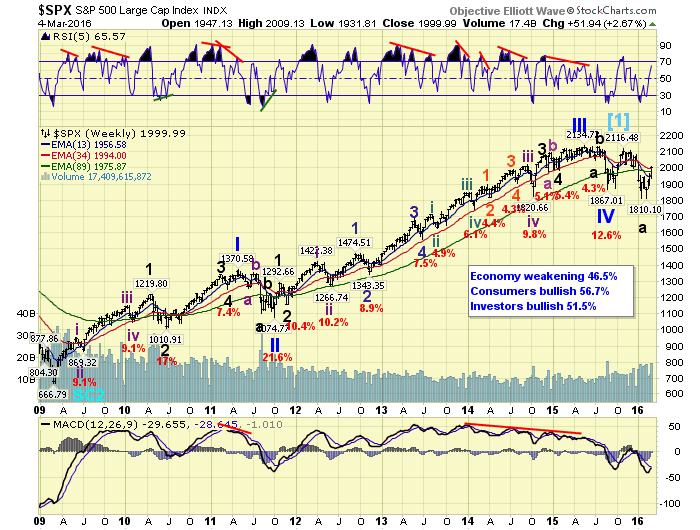
Market psychology also comes into play during the early stages of bear markets. When the first downtrend of a bear market is similar to previous corrections during the bull market, investors are likely to remain generally bullish until the total decline becomes larger than any correction during the previous bull market. During the entire 2009-2015 bull market the largest correction occurred in 2011 at 21.6%. Thus far, from the all time high of SPX 2135 to the downtrend low at SPX 1810, the market has only corrected 15.2%. As reported on Friday, investors still have a bullish 61.5% of their portfolio in stocks. This is not as high as the 68.3% they had in stocks in March 2015, when they were at their most bullish level of the entire bull market. But they are still bullish.
The long term count remains unchanged. The Cycle wave [1] bull market ended in December 2015, and a Cycle wave [2] bear market is currently underway. Major wave A ended at SPX 1810, Major wave B should be near completion, and a Major wave C downtrend should follow shortly to new bear market lows. This will only complete Primary A of the three primary wave bear market. We are still expecting a bear market low some time in the year 2017 around SPX 1100.
MEDIUM TERM: uptrend
The anticipated Major wave B uptrend finally did get confirmed by OEW, and we updated the labeling from tentative green to the appropriate colors. The internal count of the uptrend remains unchanged, as we were expecting it to unfold in three Intermediate waves. Int. wave A, which topped at SPX 1947, best counts as a three Minor wave advance: 1931-1902-1947. Then after an Int. wave B decline to SPX 1891, Int. wave C was underway.
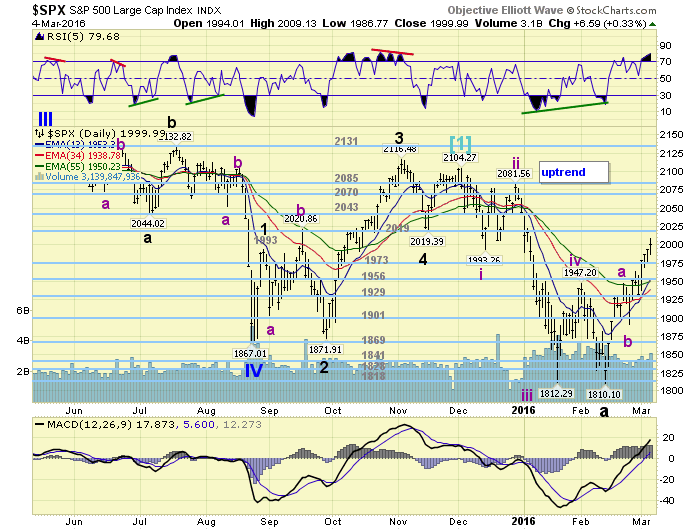
Thus far we have counted Int. wave C with: Minor A at SPX 1963, Minor B at SPX 1932 on Monday, and Minor C underway for most of this week. When Minor C ends, Int. wave C and the Major wave B uptrend will also end. Setting the stage for a Major wave C downtrend decline. Medium term support is at the 1973 and 1956 pivots, with resistance at the 2019 and 2043 pivots.
SHORT TERM
Over the past couple of weeks we had been discussing several upside targets for the Major wave B uptrend. The targets generally revolved around the 1956 and 1973 pivots, SPX 1999, and the 2019 pivot. The market exceeded the first pivot on Tuesday, the second pivot on Wednesday, and the SPX 1999 level on Friday. Which is right around where the market ended the week. The next pivot, at 2019, is the upper range of where we expected this uptrend to top. There is also one Fibonacci ratio we mentioned last week. Int. C equals Int. A at SPX 2028. If these two levels do not hold the uptrend, we are simply left with the overhead pivots posted on the hourly/daily charts.
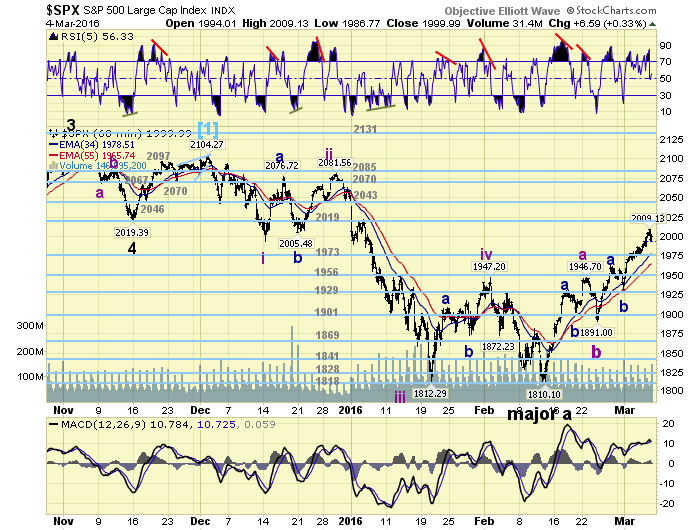
Technically, the long term monthly MACD continues to decline. Medium term daily momentum is already quite overbought and similar to recent levels at uptrend highs. And, short term momentum was quite overbought and has started to decline. Should Int. C end like Int. A, the 2019 pivot range should hold the high. Short term support is at SPX 1999 and the 1973 pivot, with resistance at the 2019 pivot and SPX 2028. Short term momentum ended the week at neutral. Best to your trading!
FOREIGN MARKETS
Asian markets were all higher on the week and gained 4.5%.
European markets were all higher as well and gained 4.1%.
The Commodity equity group soared 9.7%, led by Brazil’s 18.0% rise.
The DJ World index is in a confirmed uptrend and gained 4.0%.
COMMODITIES
Bonds appear to have started a downtrend and lost 0.9% on the week.
Crude had another strong week in its confirmed uptrend and gained 9.4%.
Gold continues to uptrend and gained 3.1%.
The USD is still in an uptrend but lost 0.9% on the week.
NEXT WEEK
Monday: two FED speeches at 1pm, vice chair Fischer and FED governor Brainard, then Consumer credit at 3pm. Wednesday: Wholesale inventories. Thursday: the ECB, weekly Jobless claims, and the Budget deficit. Friday: Export/Import prices. With little economic data on tap it looks like we could have a technical week in the market.
CHARTS: http://stockcharts.com/public/1269446/tenpp
After about 40 years of investing in the markets one learns that the markets are constantly changing, not only in price, but in what drives the markets. In the 1960s, the Nifty Fifty were the leaders of the stock market. In the 1970s, stock selection using Technical Analysis was important, as the market stayed with a trading range for the entire decade. In the 1980s, the market finally broke out of it doldrums, as the DOW broke through 1100 in 1982, and launched the greatest bull market on record.
Sharing is an important aspect of a life. Over 100 people have joined our group, from all walks of life, covering twenty three countries across the globe. It's been the most fun I have ever had in the market. Sharing uncommon knowledge, with investors. In hope of aiding them in finding their financial independence.
Copyright © 2016 Tony Caldaro - All Rights Reserved Disclaimer: The above is a matter of opinion provided for general information purposes only and is not intended as investment advice. Information and analysis above are derived from sources and utilising methods believed to be reliable, but we cannot accept responsibility for any losses you may incur as a result of this analysis. Individuals should consult with their personal financial advisors.
Tony Caldaro Archive |
© 2005-2022 http://www.MarketOracle.co.uk - The Market Oracle is a FREE Daily Financial Markets Analysis & Forecasting online publication.